Fig. 11.
Download original image
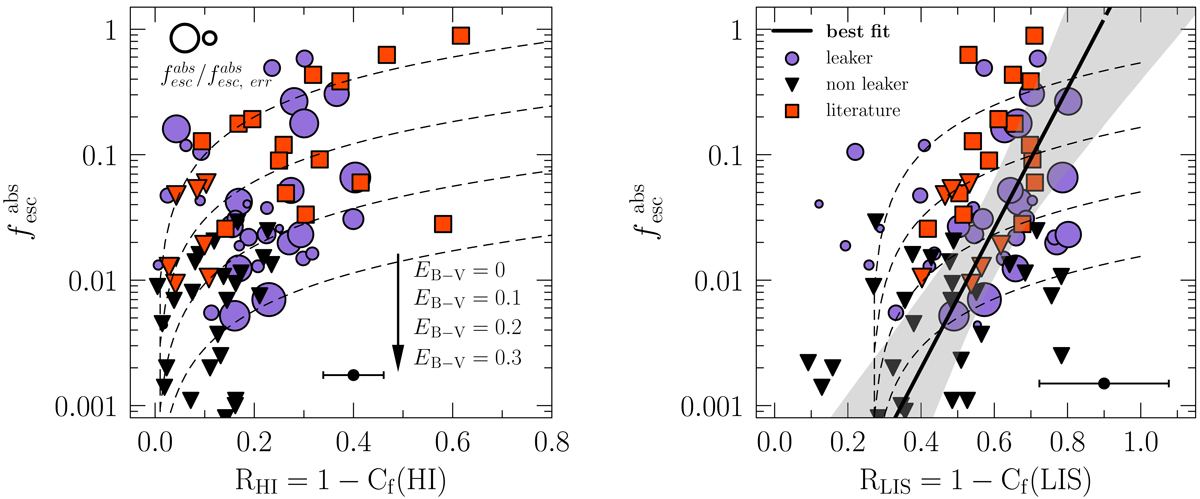
Correlation between the LyC absolute photon escape fraction (![]() ) and the H I (left) and LIS line (right) residual fluxes. Purple circles represent the leakers, while the black triangles are the nondetections – and for which the
) and the H I (left) and LIS line (right) residual fluxes. Purple circles represent the leakers, while the black triangles are the nondetections – and for which the ![]() is an upper limit. The size of the points corresponds to the relative uncertainty on the escape fraction (
is an upper limit. The size of the points corresponds to the relative uncertainty on the escape fraction (![]() ), and the median 1σ uncertainty of the residual flux is placed in the bottom-right corner of each panel. Red squares correspond to the Izotov et al. (2016a,b, 2018a,b, 2021) and Wang et al. (2019) galaxies (see legend). Overplotted are the curves predicted by Eq. (6) (right) and Eq. (12) (left) for EB-V= 0, 0.1, 0.2, and 0.3 mag, respectively (dashed lines). The black solid line in the right panel corresponds to the best linear fit, and the gray-shaded area is the 2σ confidence interval including intrinsic scatter (Eq. (10), see text).
), and the median 1σ uncertainty of the residual flux is placed in the bottom-right corner of each panel. Red squares correspond to the Izotov et al. (2016a,b, 2018a,b, 2021) and Wang et al. (2019) galaxies (see legend). Overplotted are the curves predicted by Eq. (6) (right) and Eq. (12) (left) for EB-V= 0, 0.1, 0.2, and 0.3 mag, respectively (dashed lines). The black solid line in the right panel corresponds to the best linear fit, and the gray-shaded area is the 2σ confidence interval including intrinsic scatter (Eq. (10), see text).
Current usage metrics show cumulative count of Article Views (full-text article views including HTML views, PDF and ePub downloads, according to the available data) and Abstracts Views on Vision4Press platform.
Data correspond to usage on the plateform after 2015. The current usage metrics is available 48-96 hours after online publication and is updated daily on week days.
Initial download of the metrics may take a while.