Fig. 10.
Download original image
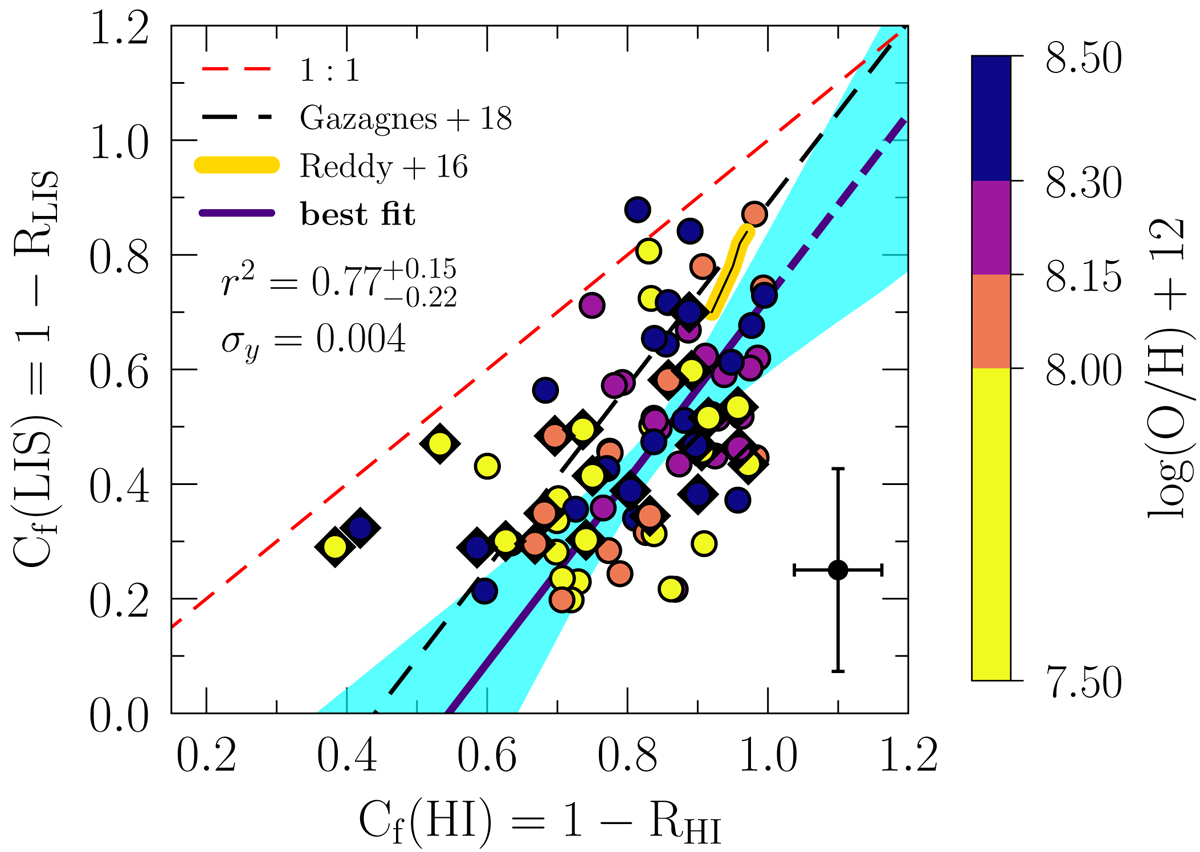
Empirical correlation between the LIS and H I covering fractions. Red, yellow, black, and dark blue lines correspond to the 1:1, Reddy et al. (2016b), and Gazagnes et al. (2018) relations and our Bayesian linear fit (LINMIX), respectively. The points are color-coded according to the gas-phase metallicity of each source, 12 + log(O/H), and typical error bars are shown in the bottom-right corner. The blue shaded area represents the 2σ confidence interval including the intrinsic scatter of the fit. The linear correlation coefficient (r2) and intrinsic scatter over the fit (σy) are given. The Izotov et al. (2016a,b, 2018a,b, 2021) and Wang et al. (2019) sources are displayed in diamonds, and also included in the fit.
Current usage metrics show cumulative count of Article Views (full-text article views including HTML views, PDF and ePub downloads, according to the available data) and Abstracts Views on Vision4Press platform.
Data correspond to usage on the plateform after 2015. The current usage metrics is available 48-96 hours after online publication and is updated daily on week days.
Initial download of the metrics may take a while.