Fig. 1.
Download original image
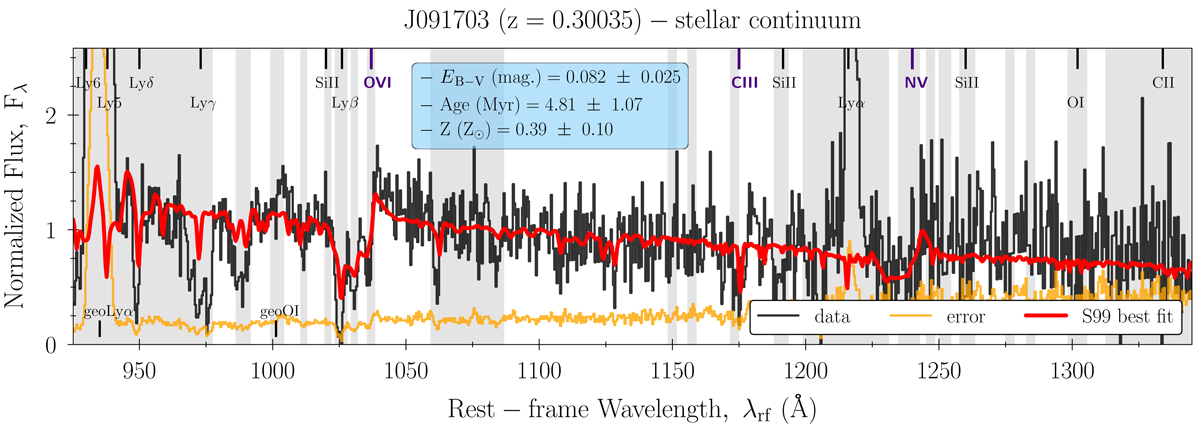
Stellar continuum modelling for the galaxy J091703. Stellar continuum fit (red), observed spectrum (black), and error spectrum (yellow); spectral regions masked during the fit are shown in gray. The spectra, shown in Fλ units, have been normalized over 1070–1100 Å. Different ISM absorption lines and stellar features are indicated with black and dark-blue vertical lines in the top part of the figure, respectively. Geo-coronal emissions are labeled at the bottom. The best-fit dust attenuation color-excess (EB−V, in mag, R16 law), light-weighted stellar age (Myr) and metallicity (Z⊙) inferred for this source are given in the inset. Uncertainties come from a consistent Monte-Carlo error propagation along the fitting routine.
Current usage metrics show cumulative count of Article Views (full-text article views including HTML views, PDF and ePub downloads, according to the available data) and Abstracts Views on Vision4Press platform.
Data correspond to usage on the plateform after 2015. The current usage metrics is available 48-96 hours after online publication and is updated daily on week days.
Initial download of the metrics may take a while.