Fig. 5
Download original image
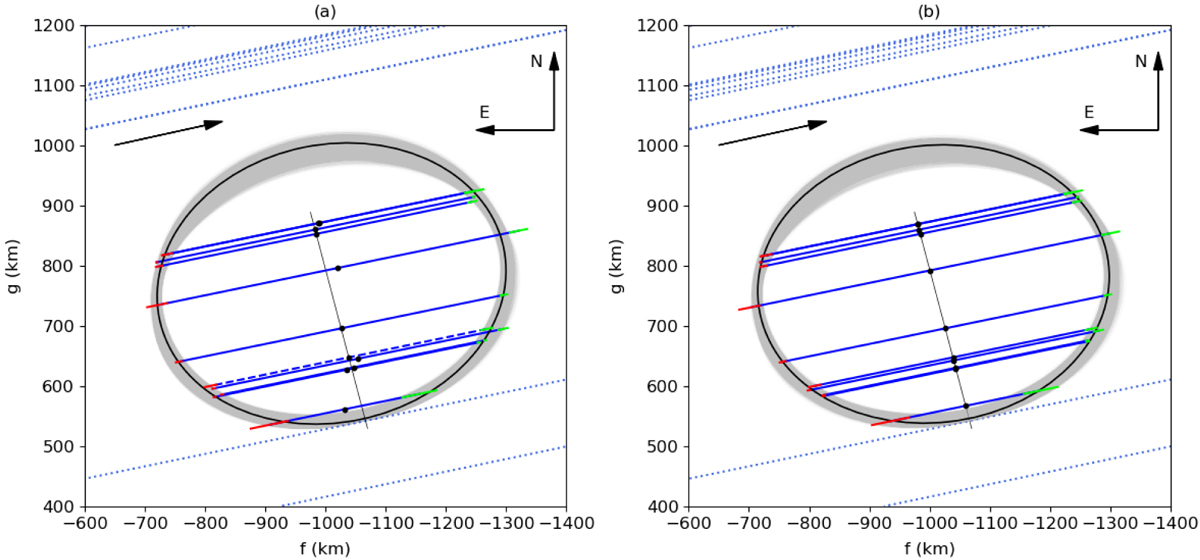
Elliptical fit to the chords of the stellar occultation for the two considered configurations: (a) original distribution of the chords, with chord 8 (dashed line) already shifted; and (b) final distribution of the chords after aligning their centers using a least squares linear fit. In both plots, the positive chords are shown in solid blue and the negative chords are in dotted blue; uncertainties of the star’s disappearance time are shown in green and those of the reappearance time are in red; and the black dots show the center of the chords. From top to bottom, the chords follow the same order as in Table 3. The limiting negative chord in the north corresponds to observer H. Mikuž and the chord limiting in the south corresponds to observer V. Dumitrescu, see Table 4. The black arrows in the top left of each plot show the direction of the shadow motion. The best elliptical fit to the extremities of the chords is shown in black and all the ellipses from the Monte Carlo distribution are plotted in gray, see Sect. 4.1 for details.
Current usage metrics show cumulative count of Article Views (full-text article views including HTML views, PDF and ePub downloads, according to the available data) and Abstracts Views on Vision4Press platform.
Data correspond to usage on the plateform after 2015. The current usage metrics is available 48-96 hours after online publication and is updated daily on week days.
Initial download of the metrics may take a while.