Fig. 4
Download original image
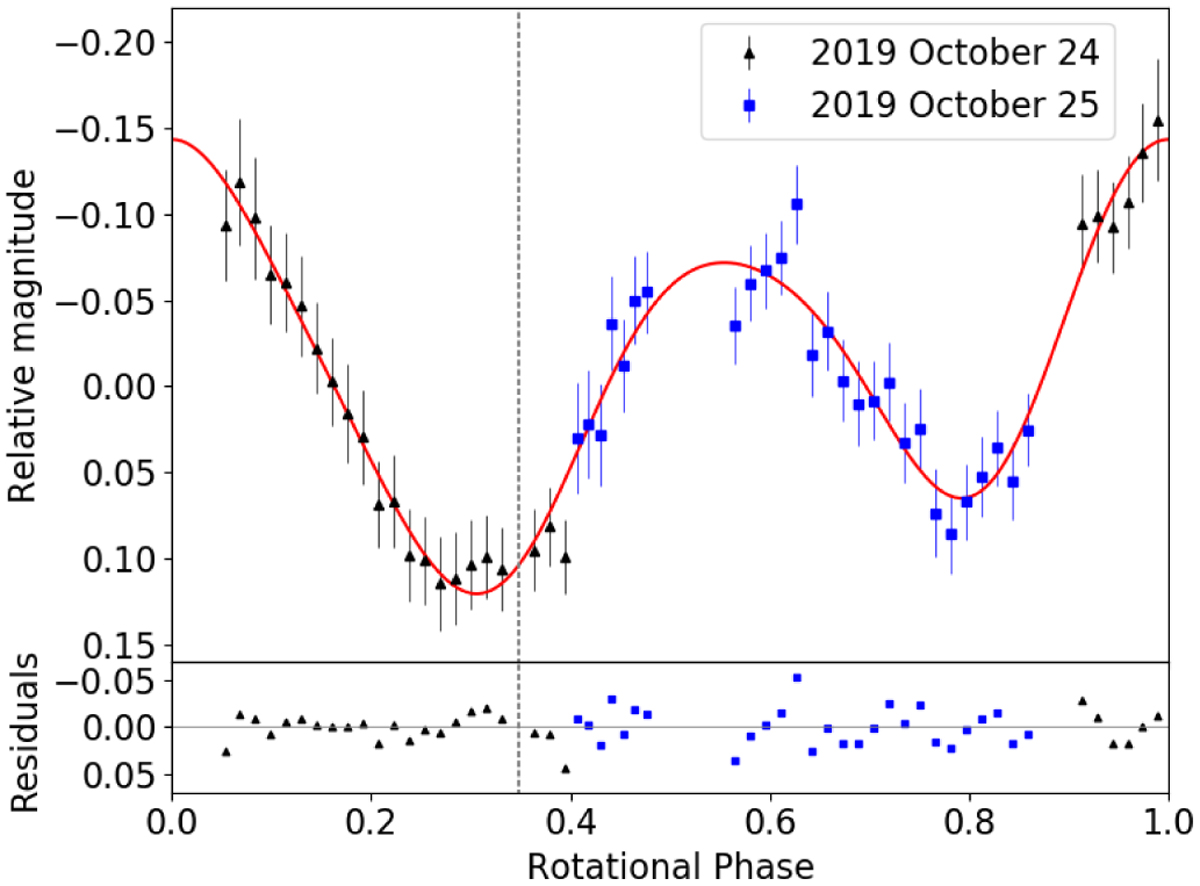
Top: rotational light curve of 2003 VS2 from data collected on 2019 October 24 (black triangles) and 25 (blue squares). The data were folded using the rotation period of 7.41753 h (Santos-Sanz et al. 2017). The fourth-order Fourier fit is shown as a solid red line. The vertical black-dashed line indicates the rotational phase of 2003 VS2 at the time of the stellar occultation. The plot has been arbitrarily shifted to make the minimum of the fit (maximum brightness) correspond to rotational phase 0. Bottom: differences between the observational data and the fit. Julian dates have not been corrected for light travel time.
Current usage metrics show cumulative count of Article Views (full-text article views including HTML views, PDF and ePub downloads, according to the available data) and Abstracts Views on Vision4Press platform.
Data correspond to usage on the plateform after 2015. The current usage metrics is available 48-96 hours after online publication and is updated daily on week days.
Initial download of the metrics may take a while.