Fig. 2
Download original image
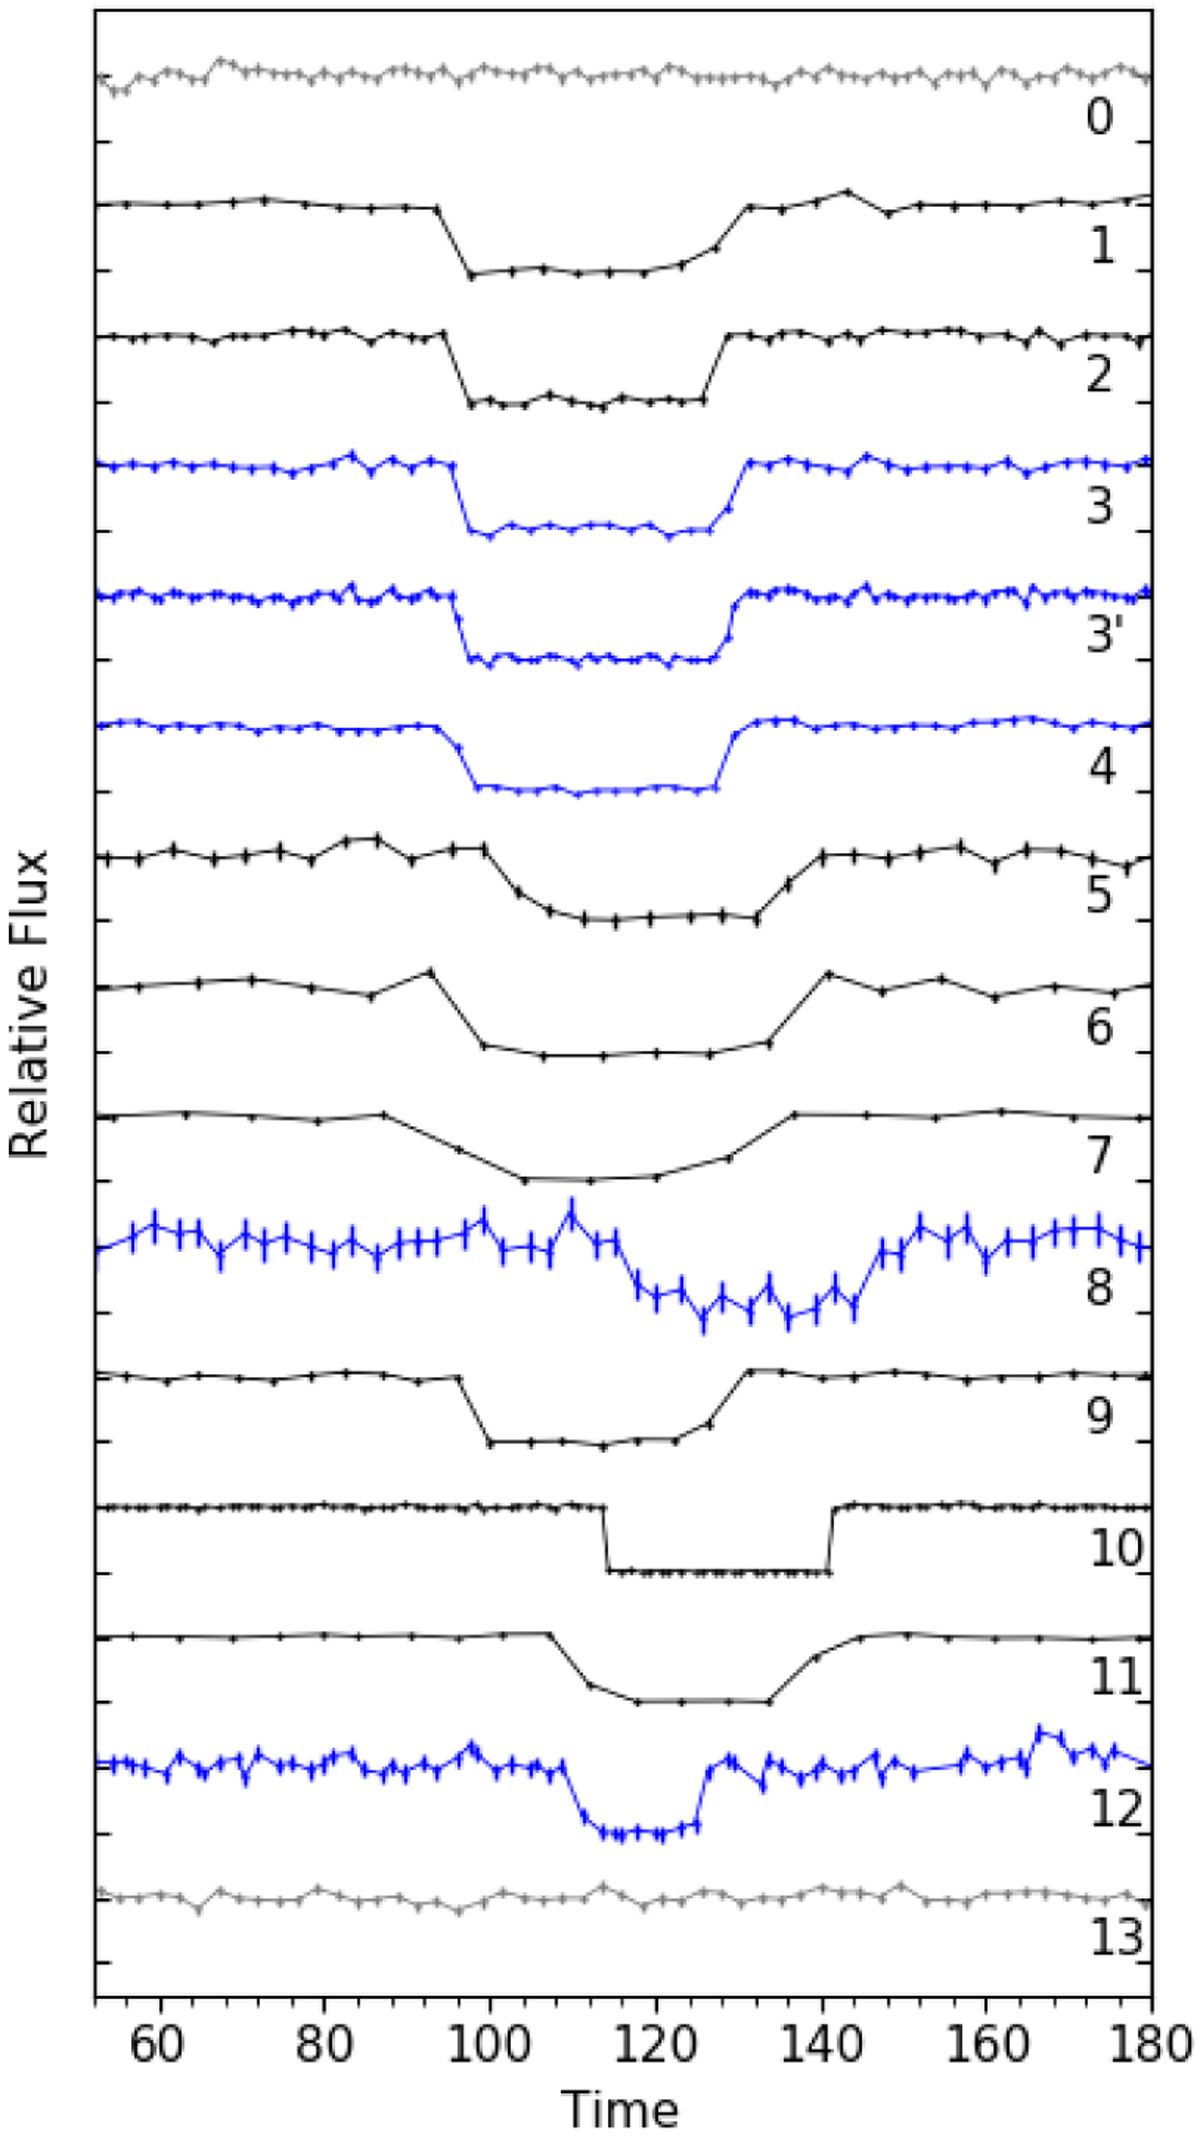
Normalized light curves from the positive detections of the stellar occultation by 2003 VS2 on 2019 October 22 and the two closest negatives. The relative flux of the occulted star with respect to the comparison chosen stars is plotted against time, given in seconds after 2019 October 22 20:40:00 UT. The uncertainty bars of the flux were plotted for all the chords, although some have the size of the points and are not visible. The light curves have been displaced in flux for better visualization and they follow the same order as in Table 3. Chords 0 and 13 (top and bottom chords, in gray) correspond to the negative detections from observers H. Mikuz and V. Dumitrescu, respectively (see Table 4.) Light curves plotted in blue required special consideration regarding time synchronization, see Sect. 3.1. Chord 3’ is the result of merging chords 3 and 4, see the text for details.
Current usage metrics show cumulative count of Article Views (full-text article views including HTML views, PDF and ePub downloads, according to the available data) and Abstracts Views on Vision4Press platform.
Data correspond to usage on the plateform after 2015. The current usage metrics is available 48-96 hours after online publication and is updated daily on week days.
Initial download of the metrics may take a while.