Fig. 6
Download original image
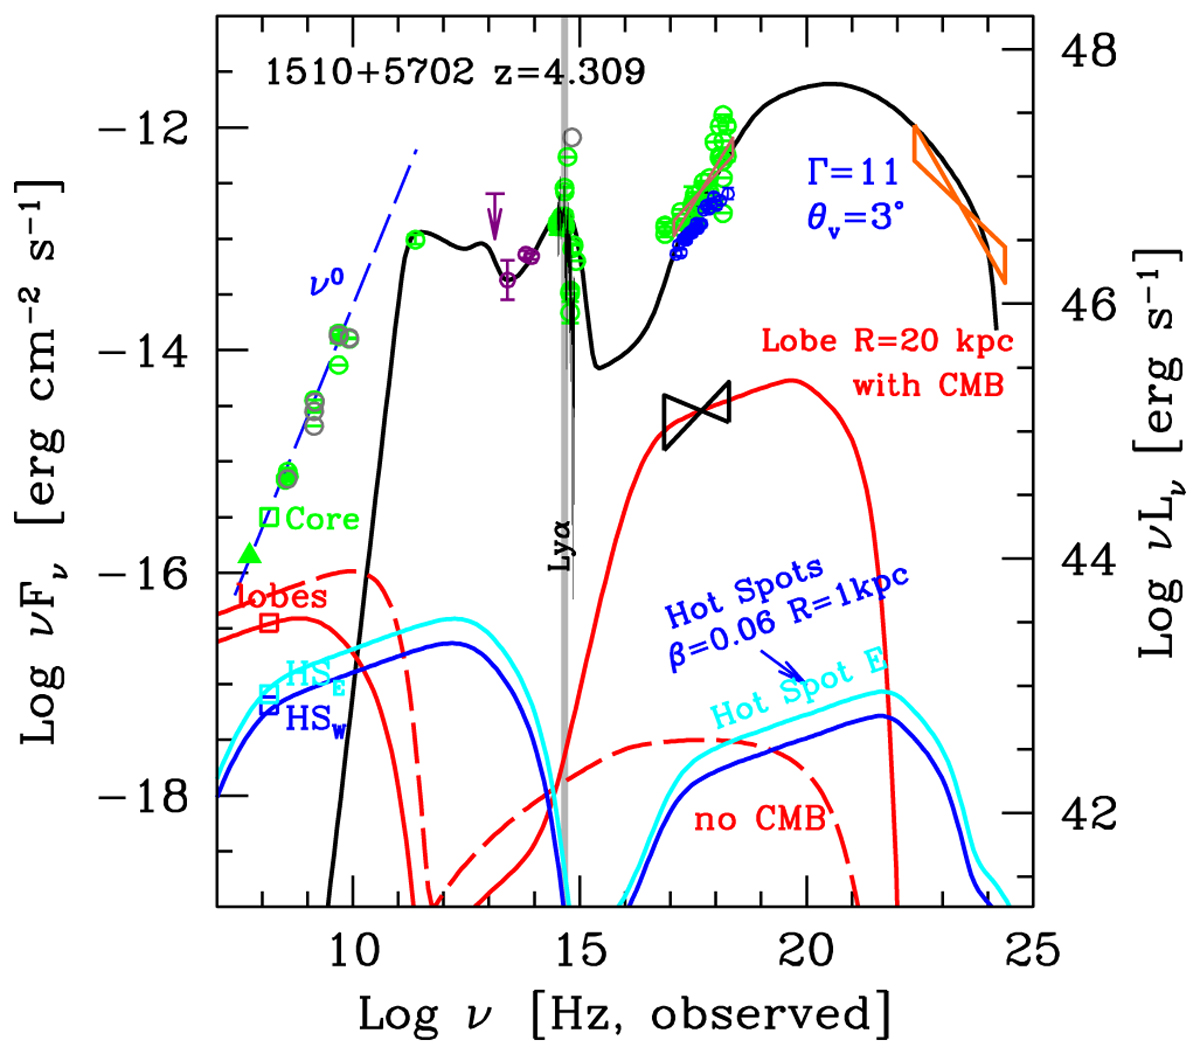
SED of 1510+5702, from radio to γ-rays. The model shown (see parameters in Table 1) describes the non-thermal jet emission, the accretion disc and the molecular torus contributions (top black solid). All data are archival (https://tools.ssdc.asi.it/). For the hot spots and the lobes (as labelled; see corresponding model parameters in Table 2) this figure corresponds to model A. The lobe with a radius of 20 kpc is responsible for the diffuse X-ray emission observed by Chandra (black butterfly spectrum). The dashed red line is the lobe emission if there were no CMB. The vertical grey line gives the position of the Lyα line. The dashed blue line is not a fit of the radio spectrum of the core, but rather has been drawn to guide the eye. The labelled data points at 144 MHz are the LOFAR determinations from this work.
Current usage metrics show cumulative count of Article Views (full-text article views including HTML views, PDF and ePub downloads, according to the available data) and Abstracts Views on Vision4Press platform.
Data correspond to usage on the plateform after 2015. The current usage metrics is available 48-96 hours after online publication and is updated daily on week days.
Initial download of the metrics may take a while.