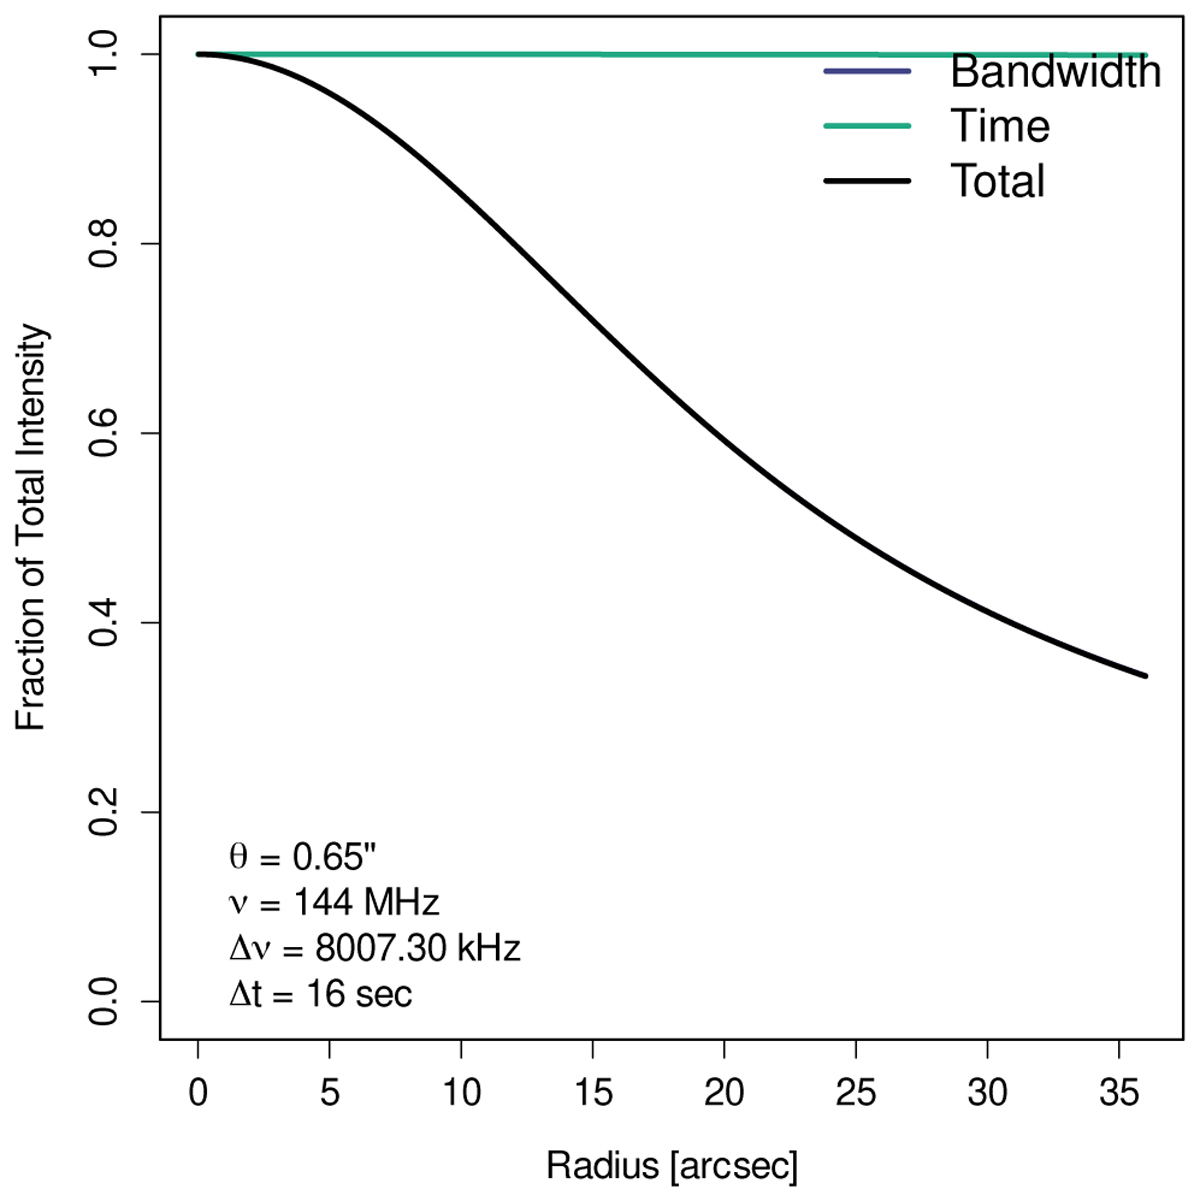
Fig. 2
Download original image
Bandwidth and time smearing losses affecting the intensity for a point source in the pointing centre as a function of radius. Calculated after Bridle & Schwab (1999). The blue line indicating the bandwidth smearing is hidden by the black line indicating the total smearing.
Current usage metrics show cumulative count of Article Views (full-text article views including HTML views, PDF and ePub downloads, according to the available data) and Abstracts Views on Vision4Press platform.
Data correspond to usage on the plateform after 2015. The current usage metrics is available 48-96 hours after online publication and is updated daily on week days.
Initial download of the metrics may take a while.