Fig. B.1
Download original image
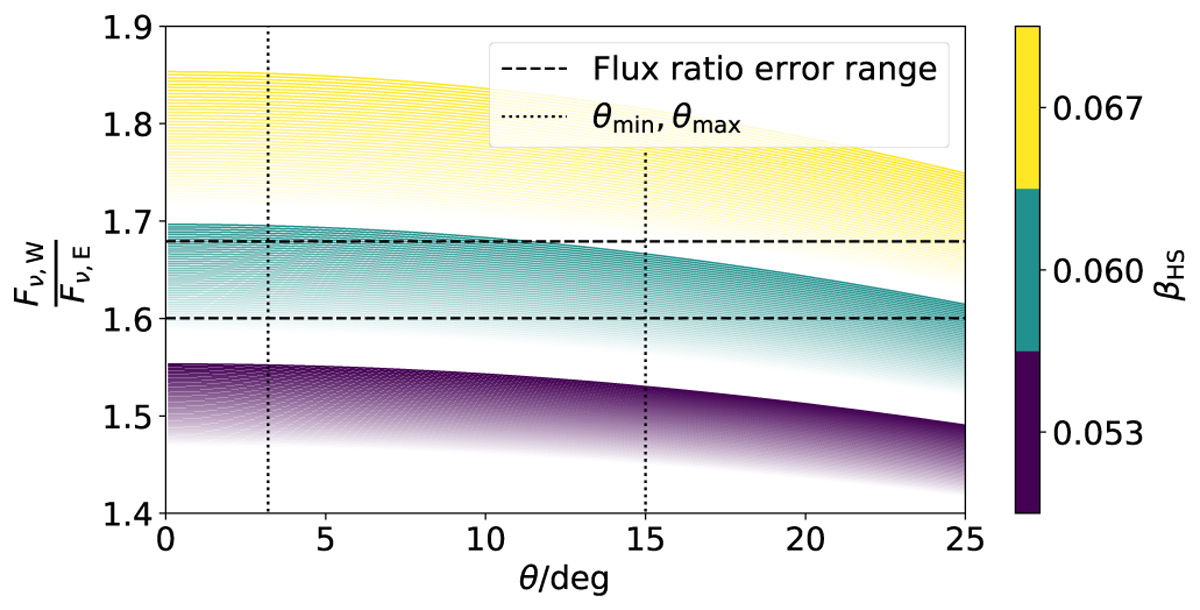
Ratio of the flux of western to eastern components, R, as a function of the inclination angle, θ, and the hot spot speed, βHS. The different hot spot speeds are colour-coded; the spectral index is given by the opaqueness of the different regions (a more saturated tone is a steeper −0.84 > α > −1.4). The dashed horizontal lines constrain the parameter space with R within its error (see Eq. B.1).The θmin value is determined by comparing the measured projected size with large radio galaxies. The θSED value shows the suggested inclination angle of the inner jet by the SED.
Current usage metrics show cumulative count of Article Views (full-text article views including HTML views, PDF and ePub downloads, according to the available data) and Abstracts Views on Vision4Press platform.
Data correspond to usage on the plateform after 2015. The current usage metrics is available 48-96 hours after online publication and is updated daily on week days.
Initial download of the metrics may take a while.