Fig. 8
Download original image
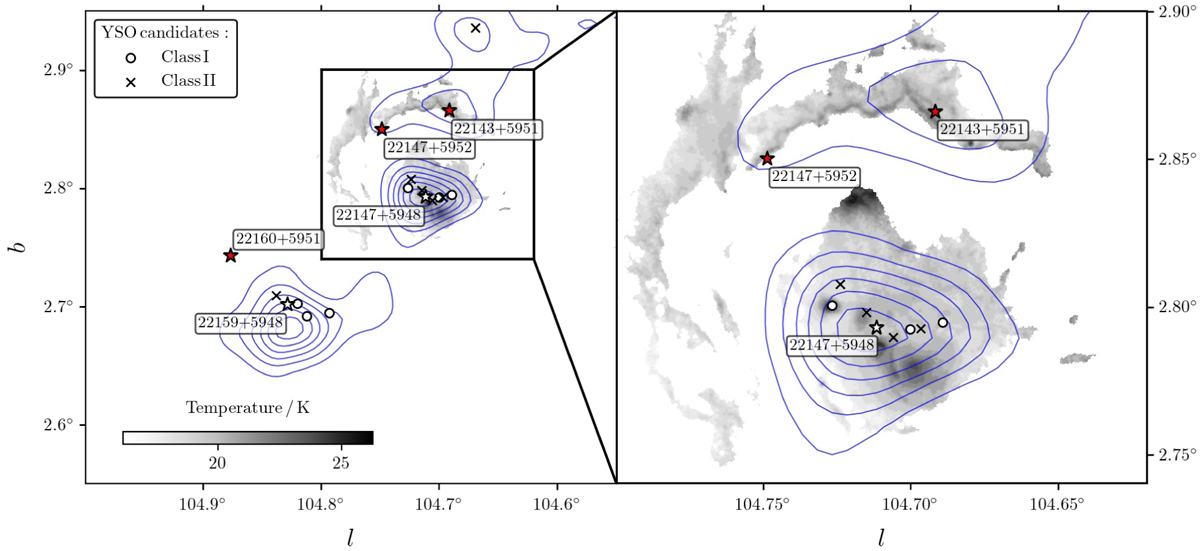
Dust temperature map (grayscale) and CO 1–0 map (blue contours) for the gas components at the distance of 5.6 kpc. The dust temperature distribution is limited to the central region, covered by the Herschel EPoS key program (Sect. 2.4 and Fig. E.1) and, therefore, does not cover the south-east feature. The CO contours start at 2.7 K km s1 (5) and are drawn in steps of 2.7 K km s1; the range of CO integrated intensities is shown on Fig. 7. The positions of YSOs, as classified via CCD/ML methods (Sects. 3.2 and 3.3), are shown in circles (Class I) and × symbols (Class II).
Current usage metrics show cumulative count of Article Views (full-text article views including HTML views, PDF and ePub downloads, according to the available data) and Abstracts Views on Vision4Press platform.
Data correspond to usage on the plateform after 2015. The current usage metrics is available 48-96 hours after online publication and is updated daily on week days.
Initial download of the metrics may take a while.