Fig. 7
Download original image
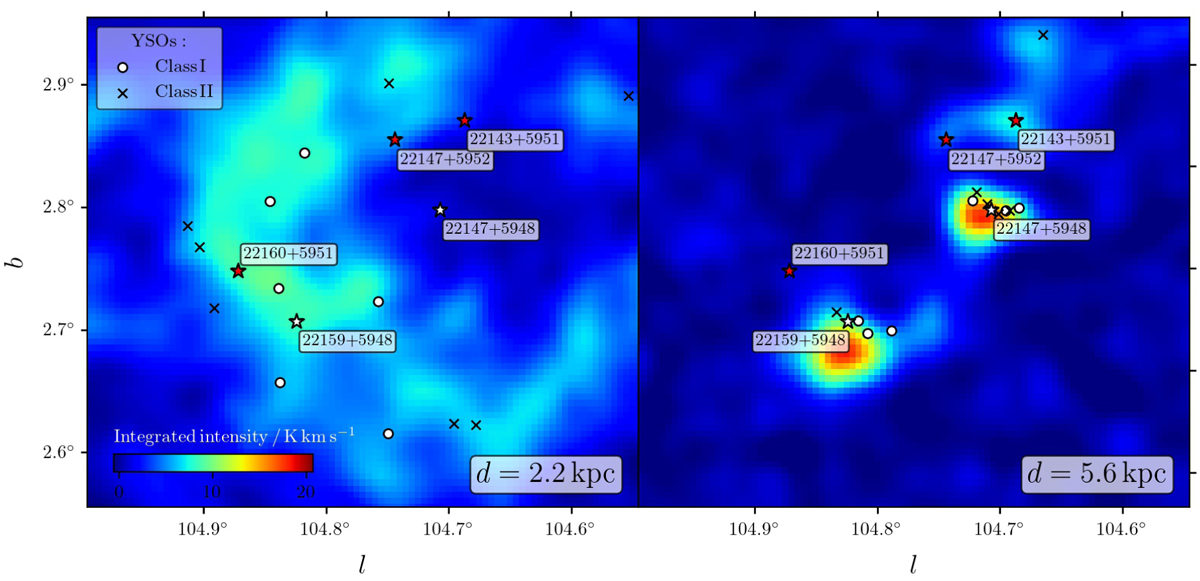
Integrated intensity CO 1–0 maps from FCRAO using velocity ranges from 25.4 km s1 to 23.7 km s1 (left) and 60.8 km s1 to 58.4 km s1 (right). The positions of YSOs, as classified via CCD/ML methods (Sects. 3.2 and 3.3), are shown in circles (Class I) and × symbols (Class II). Positions of IRAS 22147 +5948 and IRAS 22159+5948 are shown in white stars, and those of other IRAS sources in the region as red stars.
Current usage metrics show cumulative count of Article Views (full-text article views including HTML views, PDF and ePub downloads, according to the available data) and Abstracts Views on Vision4Press platform.
Data correspond to usage on the plateform after 2015. The current usage metrics is available 48-96 hours after online publication and is updated daily on week days.
Initial download of the metrics may take a while.