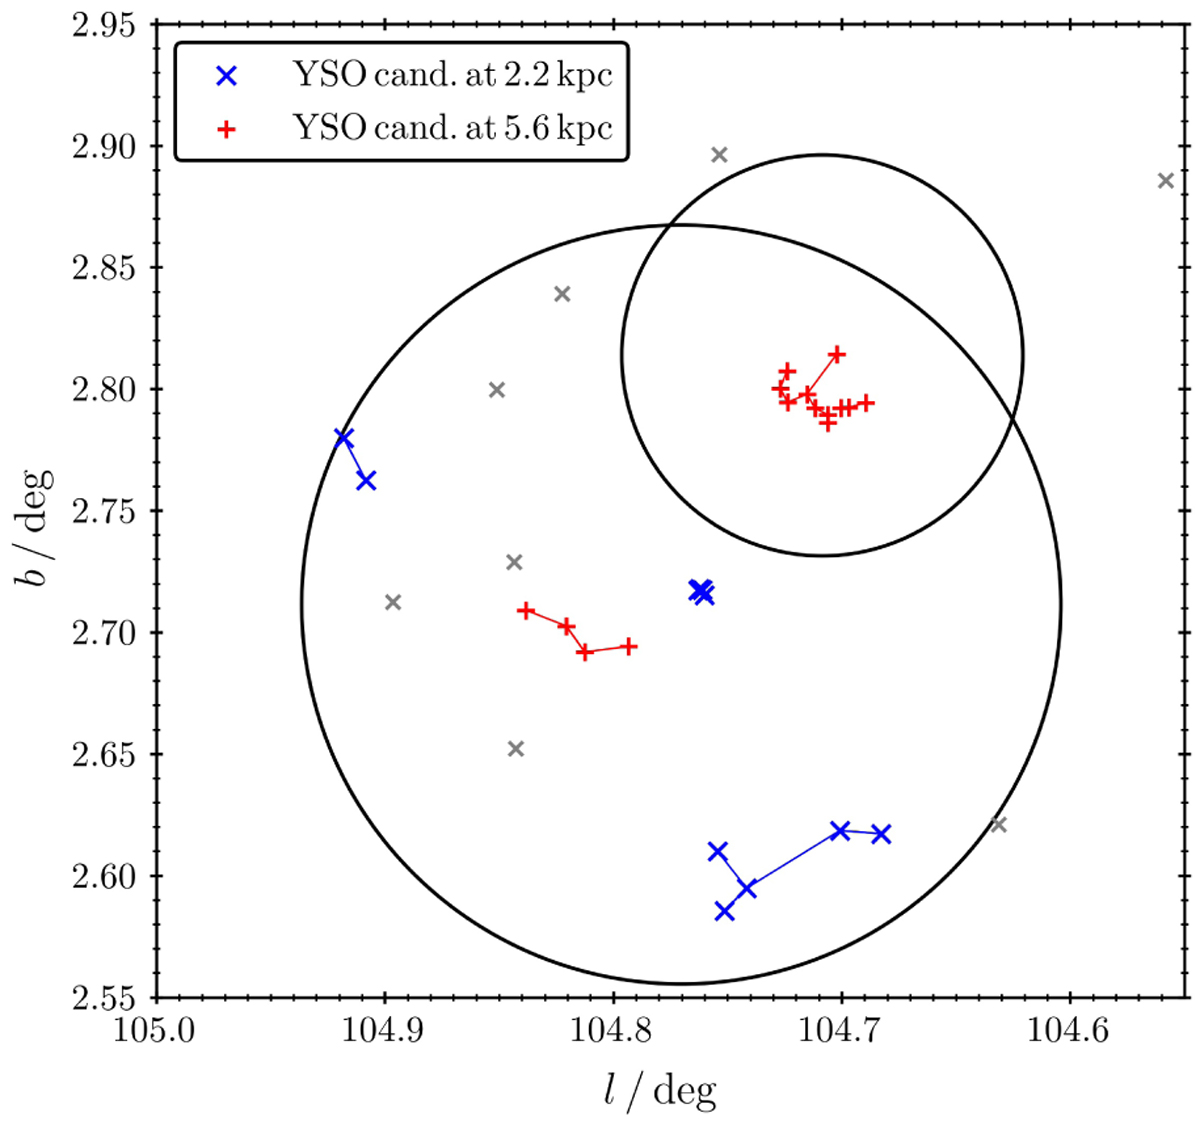
Fig. 6
Download original image
Minimum spanning tree for YSO candidates in the IRAS 22147 region. Blue and red × symbols show objects belonging to clusters located at d ~ 2.2 and d ~ 5.6 kpc, respectively; the isolated objects are shown as gray × symbols. Blue and red lines correspond to branches connecting objects from the same clusters. Black circles correspond to the two clusters identified in the region by Winston et al. (2019).
Current usage metrics show cumulative count of Article Views (full-text article views including HTML views, PDF and ePub downloads, according to the available data) and Abstracts Views on Vision4Press platform.
Data correspond to usage on the plateform after 2015. The current usage metrics is available 48-96 hours after online publication and is updated daily on week days.
Initial download of the metrics may take a while.