Fig. 5
Download original image
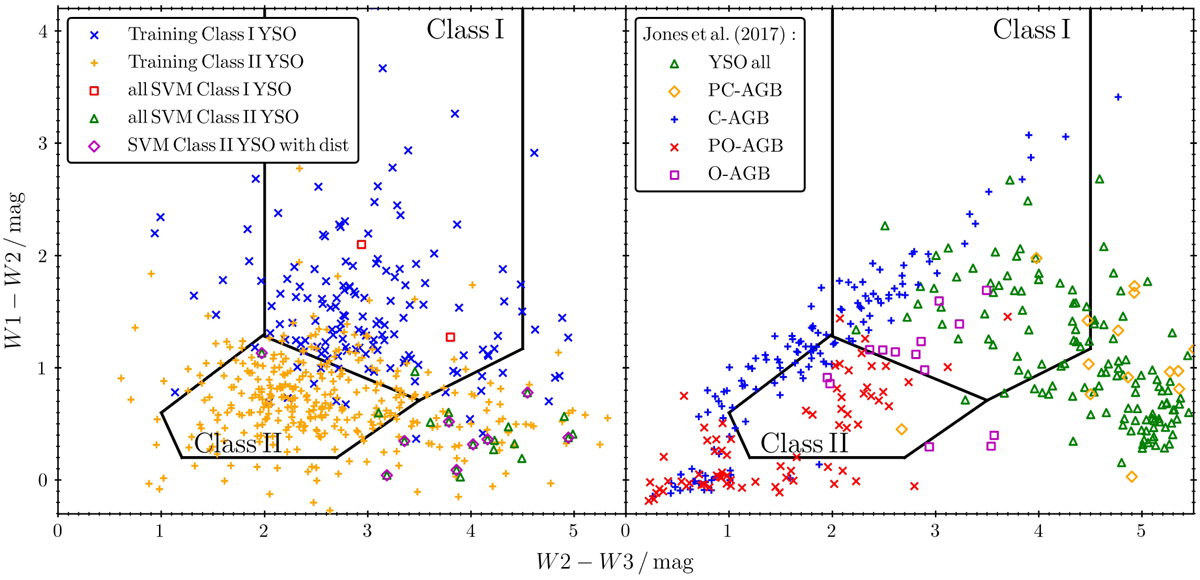
Color–color diagrams using the AllWISE catalog. Left: W1W2 vs. W2W3 diagram with SVM selected YSO Class I (red squares) and Class II (green triangles) candidates. Pink diamonds mark the position of SVM-selected YSO candidates with measured distances for Class II. Blue × and orange + symbols show the position of the training YSO I (151 objects) and II (346 objects), respectively, based on the Spitzer selection in the entire SMOG survey area. Black lines mark the boundaries of color spaces within which Class I and Class II are expected to lie following the work of Fischer et al. (2016). Right: W1W2 vs. W2W3 diagram showing the positions of spectroscopically confirmed YSOs and AGB stars from Jones et al. (2017). Green triangles mark all YSOs, yellow diamonds mark the carbon-rich post AGB stars (PC-AGB), blue crosses signs mark the carbon-rich AGB stars (C-AGB), magenta × symbols mark oxygen-rich post AGB stars (PO-AGB), and pink × symbols mark the oxygen-rich AGB stars (O-AGB).
Current usage metrics show cumulative count of Article Views (full-text article views including HTML views, PDF and ePub downloads, according to the available data) and Abstracts Views on Vision4Press platform.
Data correspond to usage on the plateform after 2015. The current usage metrics is available 48-96 hours after online publication and is updated daily on week days.
Initial download of the metrics may take a while.