Fig. 3
Download original image
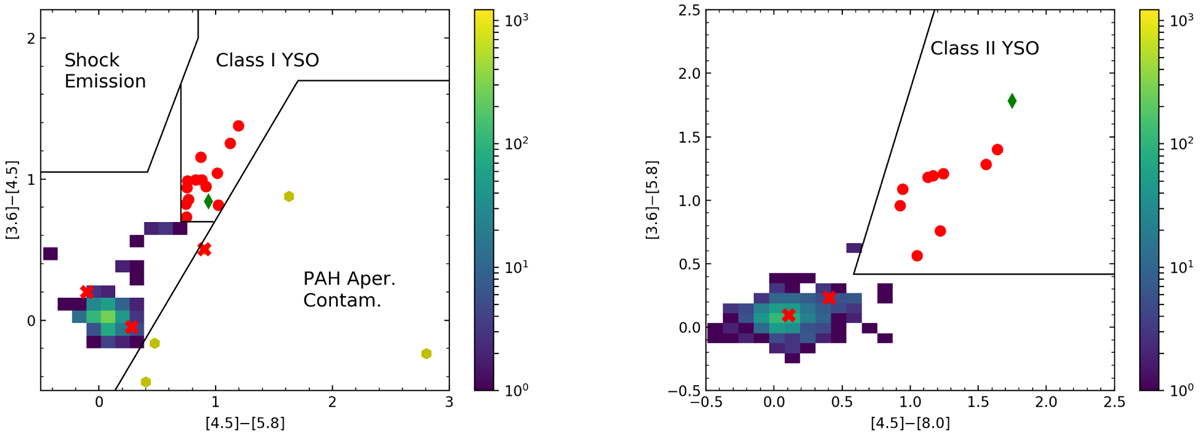
Color-color diagrams using the photometry from Spitzer/IRAC. Left: [3.6]–[4.5] vs. [4.5]–[5.8] diagram for the IRAS 22147 region, where all 681 sources with distances and IRAC errors < 0.2 mag are shown. Normal stars are depicted as a Hess diagram (color bar), and excess PAH emission contaminants are shown with light green hexagons and Class I YSOs with red circles. The dark green diamond represents the source initially classified as a Class I YSO, but later re-classified as a heavily reddened Class II source, based on its 24 µm flux. Red × symbols indicate three objects identified as YSOs by Winston et al. (2019) but failing to pass our selection criteria (see Sect. 3.4). Right: [3.6]–[5.8] vs. [4.5]–[8.0] diagram for the IRAS 22147 region, with Class I YSOs and excess PAH emission contaminants from the left panel removed. Symbols are the same as in the left panel.
Current usage metrics show cumulative count of Article Views (full-text article views including HTML views, PDF and ePub downloads, according to the available data) and Abstracts Views on Vision4Press platform.
Data correspond to usage on the plateform after 2015. The current usage metrics is available 48-96 hours after online publication and is updated daily on week days.
Initial download of the metrics may take a while.