Fig. E.1
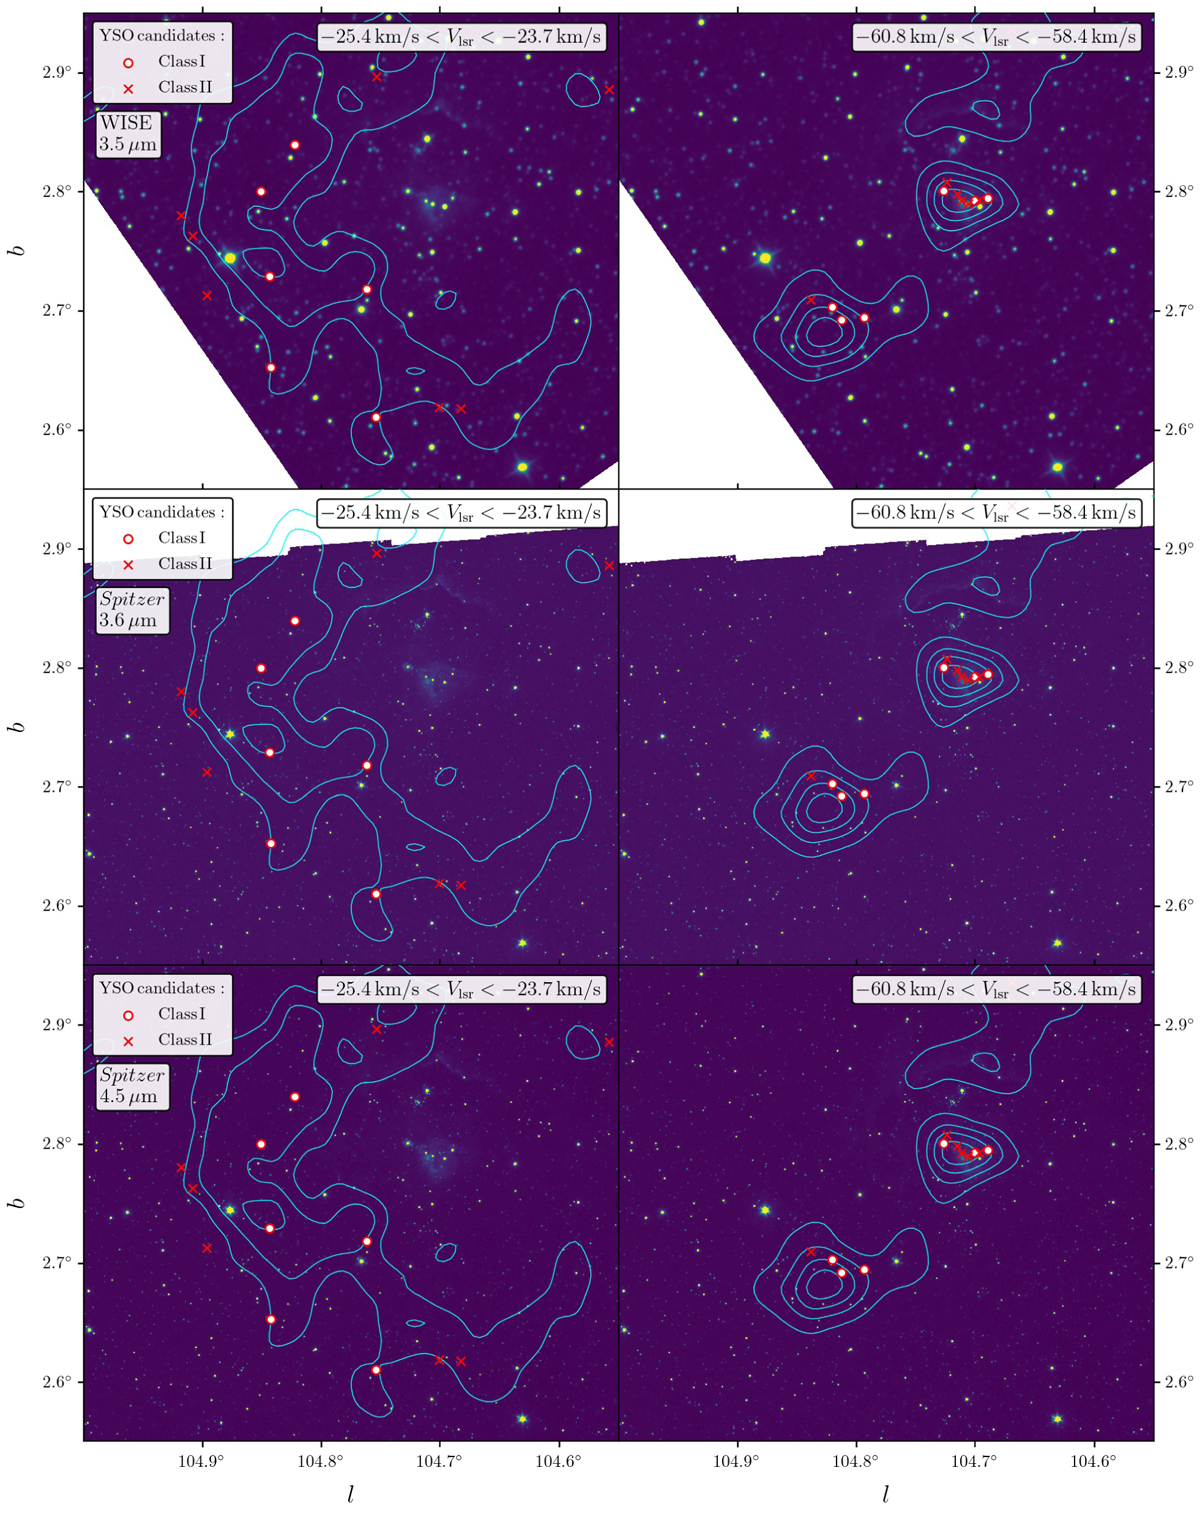
Download original image
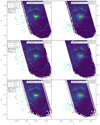
Available multi-band imaging of the IRAS 22147 region, as noted in the top left corner of each row. The left and right columns in each row correspond to the two main local standard of rest (LSR) velocity ranges found in the 12CO J = 1 − 0 cubes, as specified in the top right corner of each stamp. We overlaid the YSO candidates in red and the 12CO J = 1 − 0 contours in cyan color.
Current usage metrics show cumulative count of Article Views (full-text article views including HTML views, PDF and ePub downloads, according to the available data) and Abstracts Views on Vision4Press platform.
Data correspond to usage on the plateform after 2015. The current usage metrics is available 48-96 hours after online publication and is updated daily on week days.
Initial download of the metrics may take a while.