Fig. A.1
Download original image
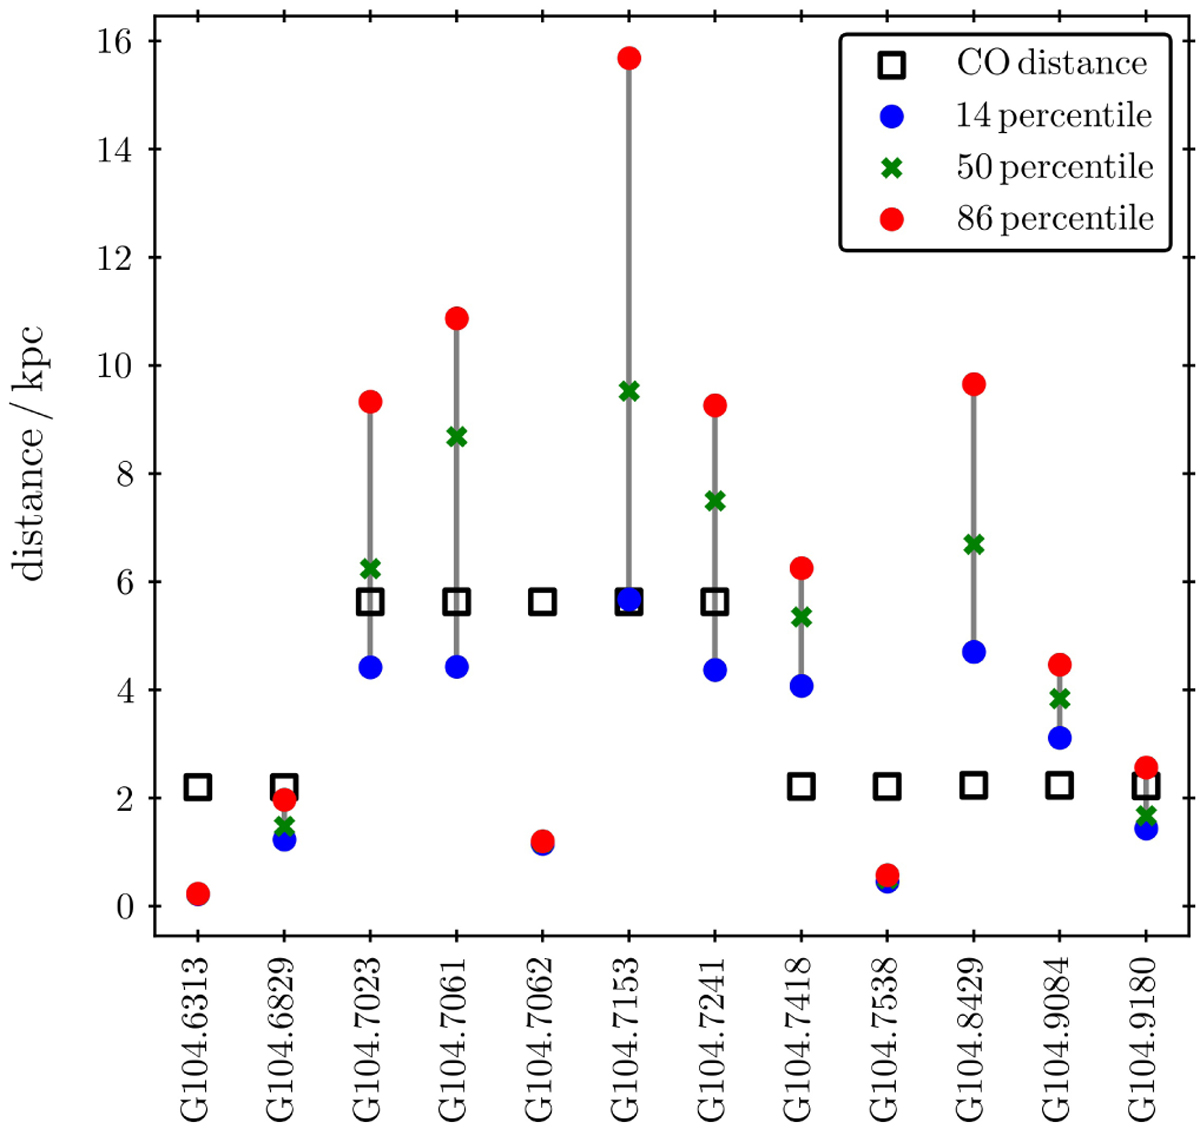
Comparison of the kinematic distances of YSOs in the IRAS 22147 region obtained using CO observations and the distances from Gaia (Bailer-Jones et al. 2021). Black empty squares show the kinematic distance obtained using CO emission (Section 3.1). Blue dots, green crosses, and red dots show the 14th, 50th (median), and the 86th percentile of photogeometric distance distribution. The full names of YSOs and their equatorial coordinates are provided in Table A.1.
Current usage metrics show cumulative count of Article Views (full-text article views including HTML views, PDF and ePub downloads, according to the available data) and Abstracts Views on Vision4Press platform.
Data correspond to usage on the plateform after 2015. The current usage metrics is available 48-96 hours after online publication and is updated daily on week days.
Initial download of the metrics may take a while.