Fig. 11
Download original image
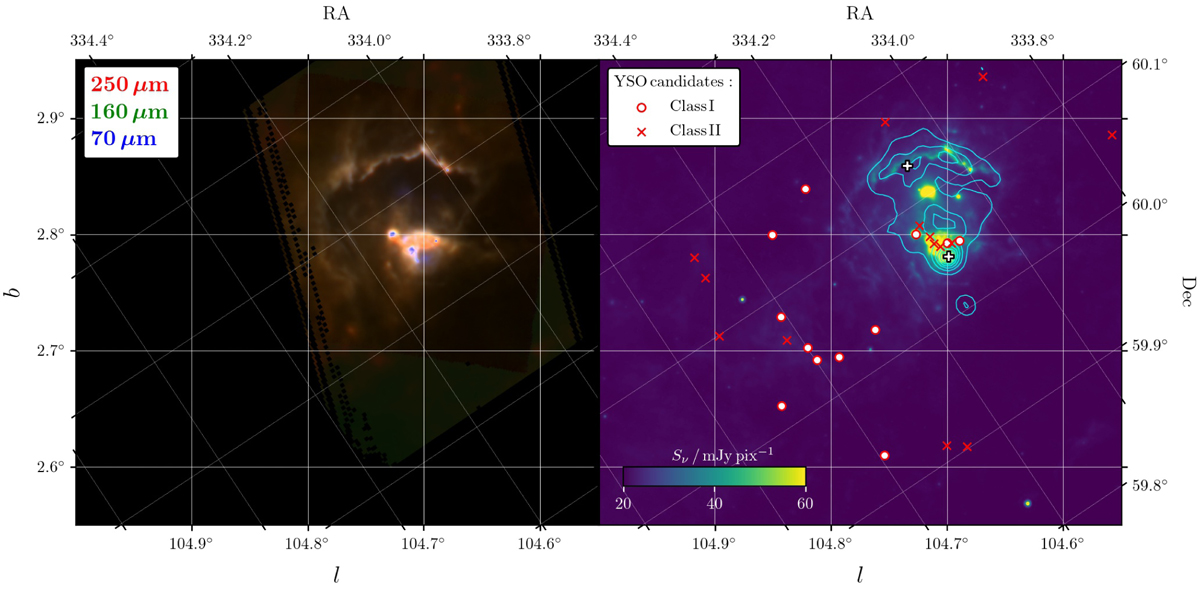
Far-IR and radio images of the IRAS 22147 region. Left: three-color composite image of the IRAS 22147 region combining the Herschel/EPoS SPIRE 250 µm (red), PACS 160 µm (green), and PACS 70 µm (blue) mosaics. Right: Spitzer/MIVS 24 µm image with the VLA 1.4 GHz radio continuum contours overlaid (Green & Joncas 1994). Positions of YSO candidates identified in this work are shown in red symbols, as specified in the legend. White xs show central positions of HII regions G104.735+02.859 at 7.8 kpc (position at the arc) and G104.699+02.781 at6.6kpc (Anderson etal. 2015).
Current usage metrics show cumulative count of Article Views (full-text article views including HTML views, PDF and ePub downloads, according to the available data) and Abstracts Views on Vision4Press platform.
Data correspond to usage on the plateform after 2015. The current usage metrics is available 48-96 hours after online publication and is updated daily on week days.
Initial download of the metrics may take a while.