Open Access
Fig. 10
Download original image
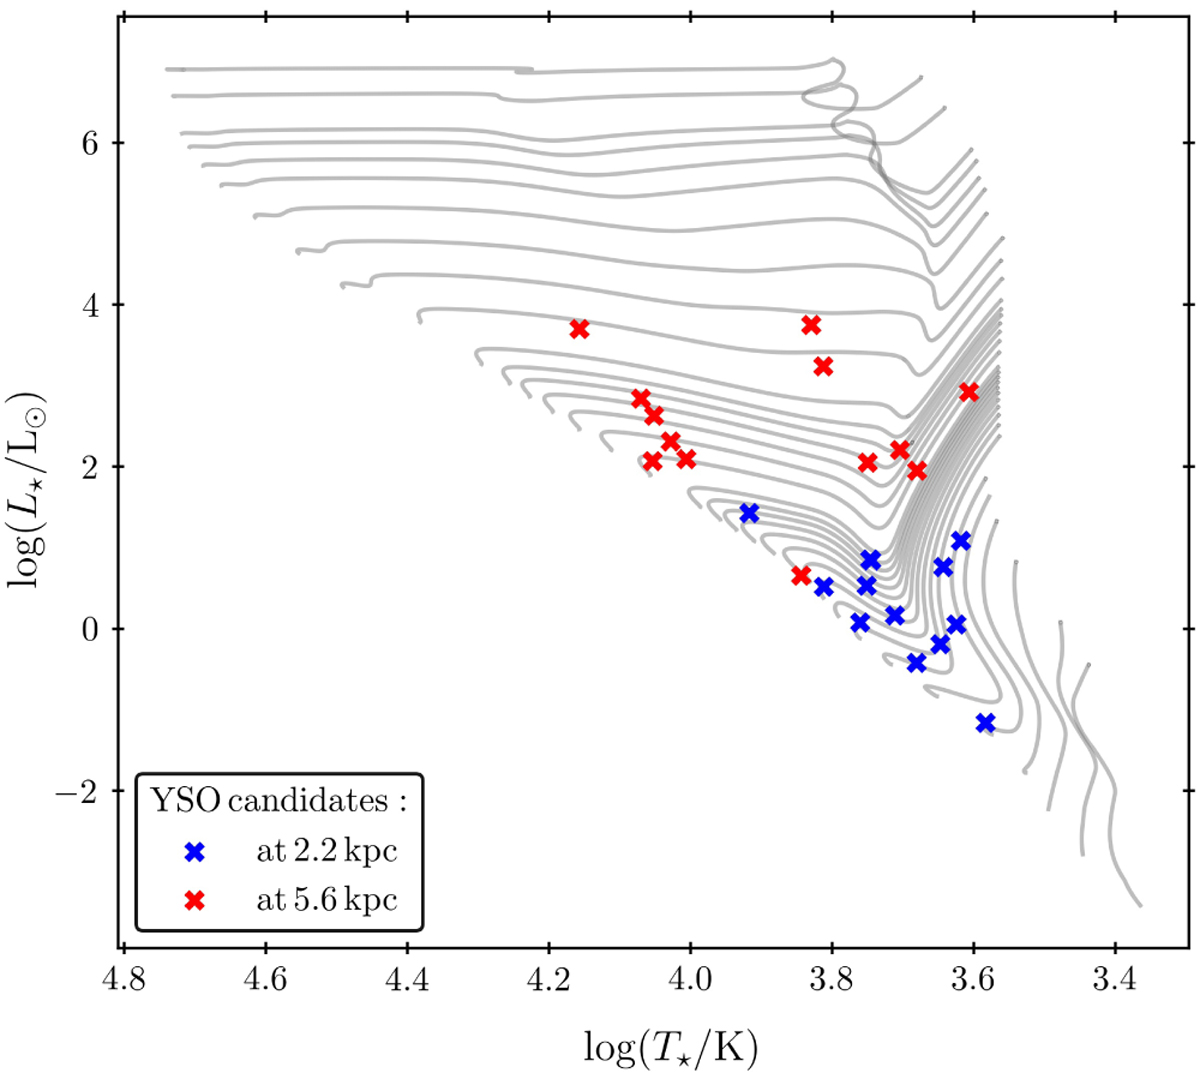
HR diagram with YSOs in the IRAS 22147 region and the PAR-SEC evolutionary tracks (Bressan et al. 2012; Chen et al. 2014, 2015; Tang et al. 2014). YSOs located at ~2.2 kpc are in blue, and at ~5.6 kpc are in red. Every third track is drawn for clarity.
Current usage metrics show cumulative count of Article Views (full-text article views including HTML views, PDF and ePub downloads, according to the available data) and Abstracts Views on Vision4Press platform.
Data correspond to usage on the plateform after 2015. The current usage metrics is available 48-96 hours after online publication and is updated daily on week days.
Initial download of the metrics may take a while.