Fig. 14
Download original image
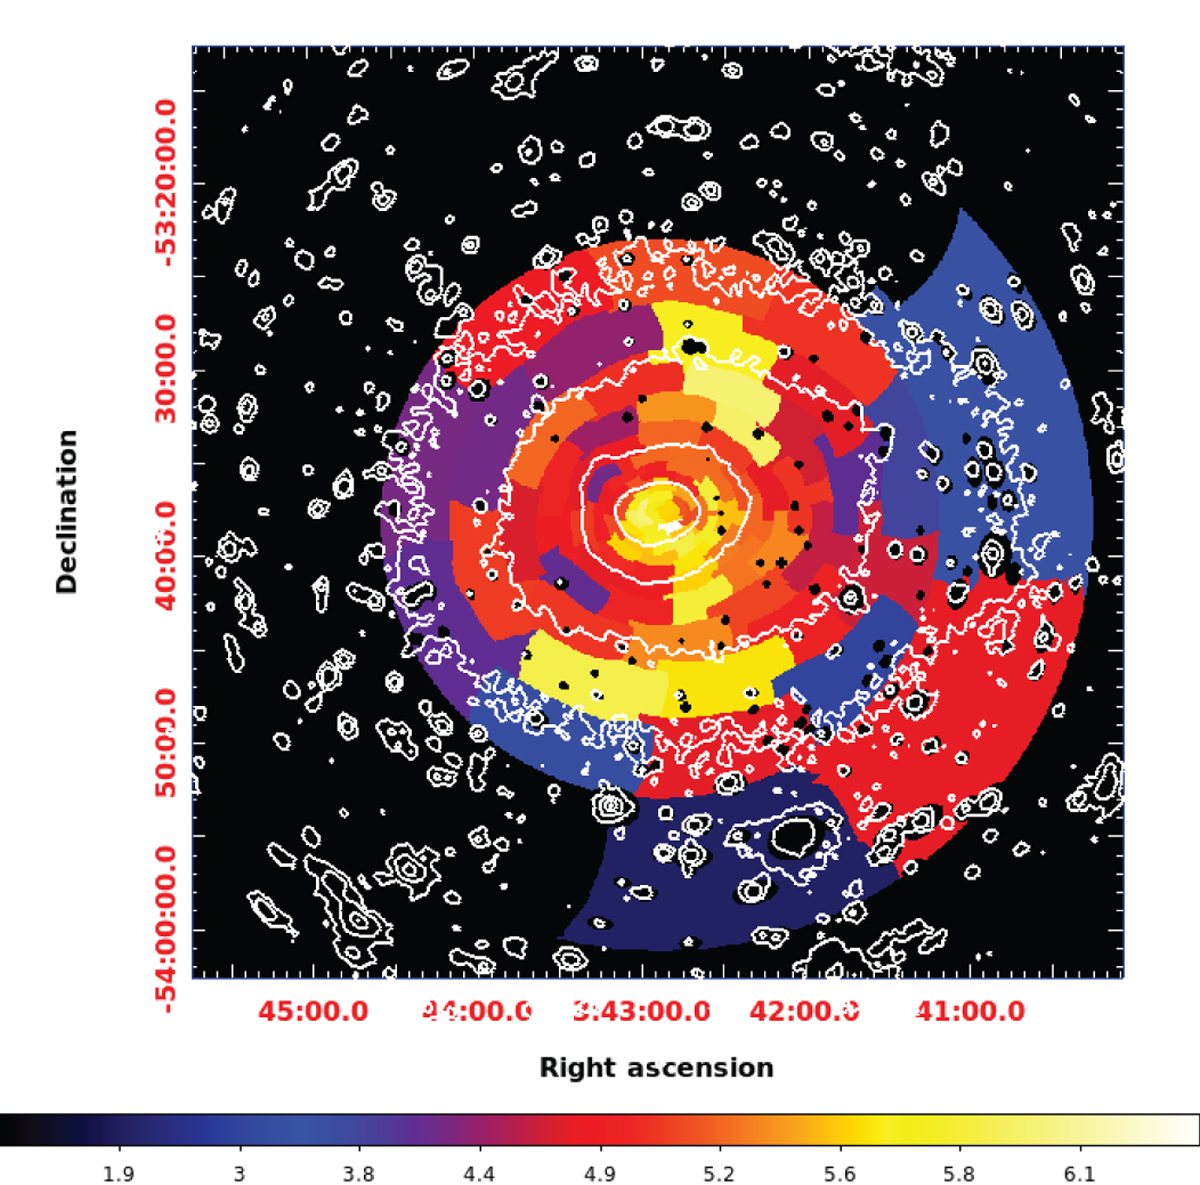
Temperature map of Abell 3158 from eROSITA. The SPT cluster has been masked. The colour bar represents the temperature in keV. eROSITA A3158 contours are overlaid in white. The corresponding relative error map is shown in Fig. 15.
Current usage metrics show cumulative count of Article Views (full-text article views including HTML views, PDF and ePub downloads, according to the available data) and Abstracts Views on Vision4Press platform.
Data correspond to usage on the plateform after 2015. The current usage metrics is available 48-96 hours after online publication and is updated daily on week days.
Initial download of the metrics may take a while.