Fig. A.1

Download original image
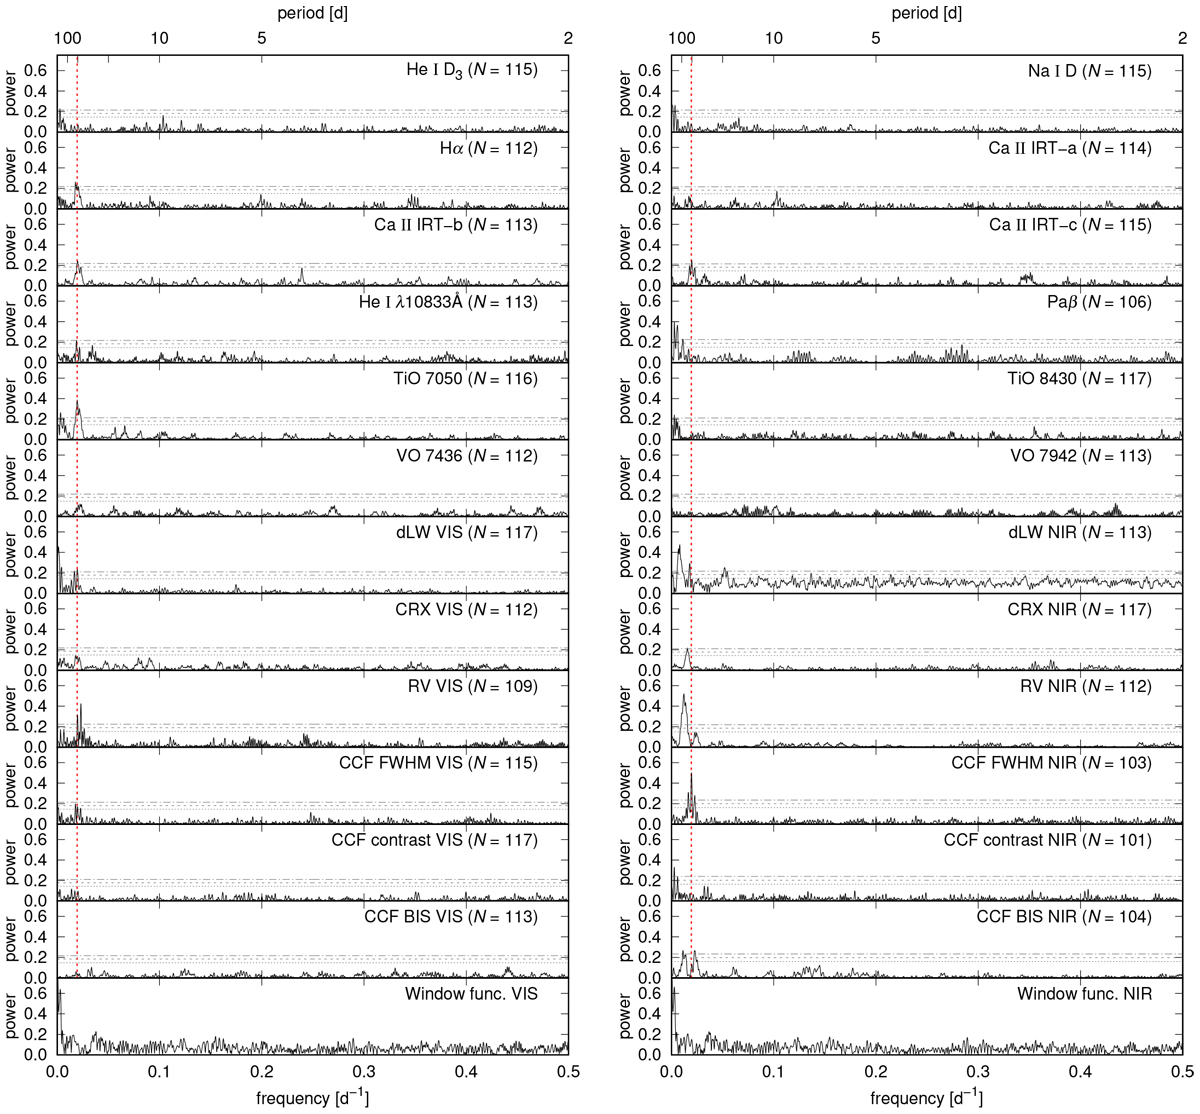
GLS periodograms of our indicators and window functions for Ross 318. The indicators are the pEW′ of chromospheric emission lines (He i D3, NaI D, Hα, and Ca ii IRT in the visible-light channel of CARMENES, He i λ10833 Å and Paβ lines in the near-infrared channel), indices of photospheric absorption bands (TiO 7050, TiO 8430, VO 7436, VO 7942), and differential line width (dLW), chromatic index (CRX), radial velocity (RV), CCF FWHM, CCF contrast, and CCF bisector inverse slope (BIS) in each channel. Horizontal lines indicate the analytical 10% (dotted), 1% (dashed), and 0.1% (dash-dotted) false-alarm probability levels. N is the number of used data points after a 2σ clipping for each indicator. For most signals at a frequency f, there are aliases at 1 d−1 − f. The red dotted line marks the rotation frequency frot = 0.0194d−1 (Prot = 51.5 d).
Current usage metrics show cumulative count of Article Views (full-text article views including HTML views, PDF and ePub downloads, according to the available data) and Abstracts Views on Vision4Press platform.
Data correspond to usage on the plateform after 2015. The current usage metrics is available 48-96 hours after online publication and is updated daily on week days.
Initial download of the metrics may take a while.


