Fig. A.1

Download original image
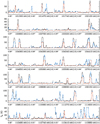
Transitions of CH3OH, υ = 0 covered by the ReMoCA survey with ALMA. The best-fit LTE synthetic spectrum of CH3OH, υ = 0 is displayed in red and overlaid on the observed spectrum of Sgr B2(N2b) shown in black. The blue synthetic spectrum contains the contributions of all molecules identified in our survey so far, including the species shown in red. The central frequency is indicated in MHz below each panel as well as the half-power beam width on the left, the width of each panel in MHz in parentheses, and the continuum level in K of the baseline-subtracted spectra in brackets. The y-axis is labeled in brightness temperature units (K). The dotted line indicates the 3σ- noise level.
Current usage metrics show cumulative count of Article Views (full-text article views including HTML views, PDF and ePub downloads, according to the available data) and Abstracts Views on Vision4Press platform.
Data correspond to usage on the plateform after 2015. The current usage metrics is available 48-96 hours after online publication and is updated daily on week days.
Initial download of the metrics may take a while.