Fig. 5.
Download original image
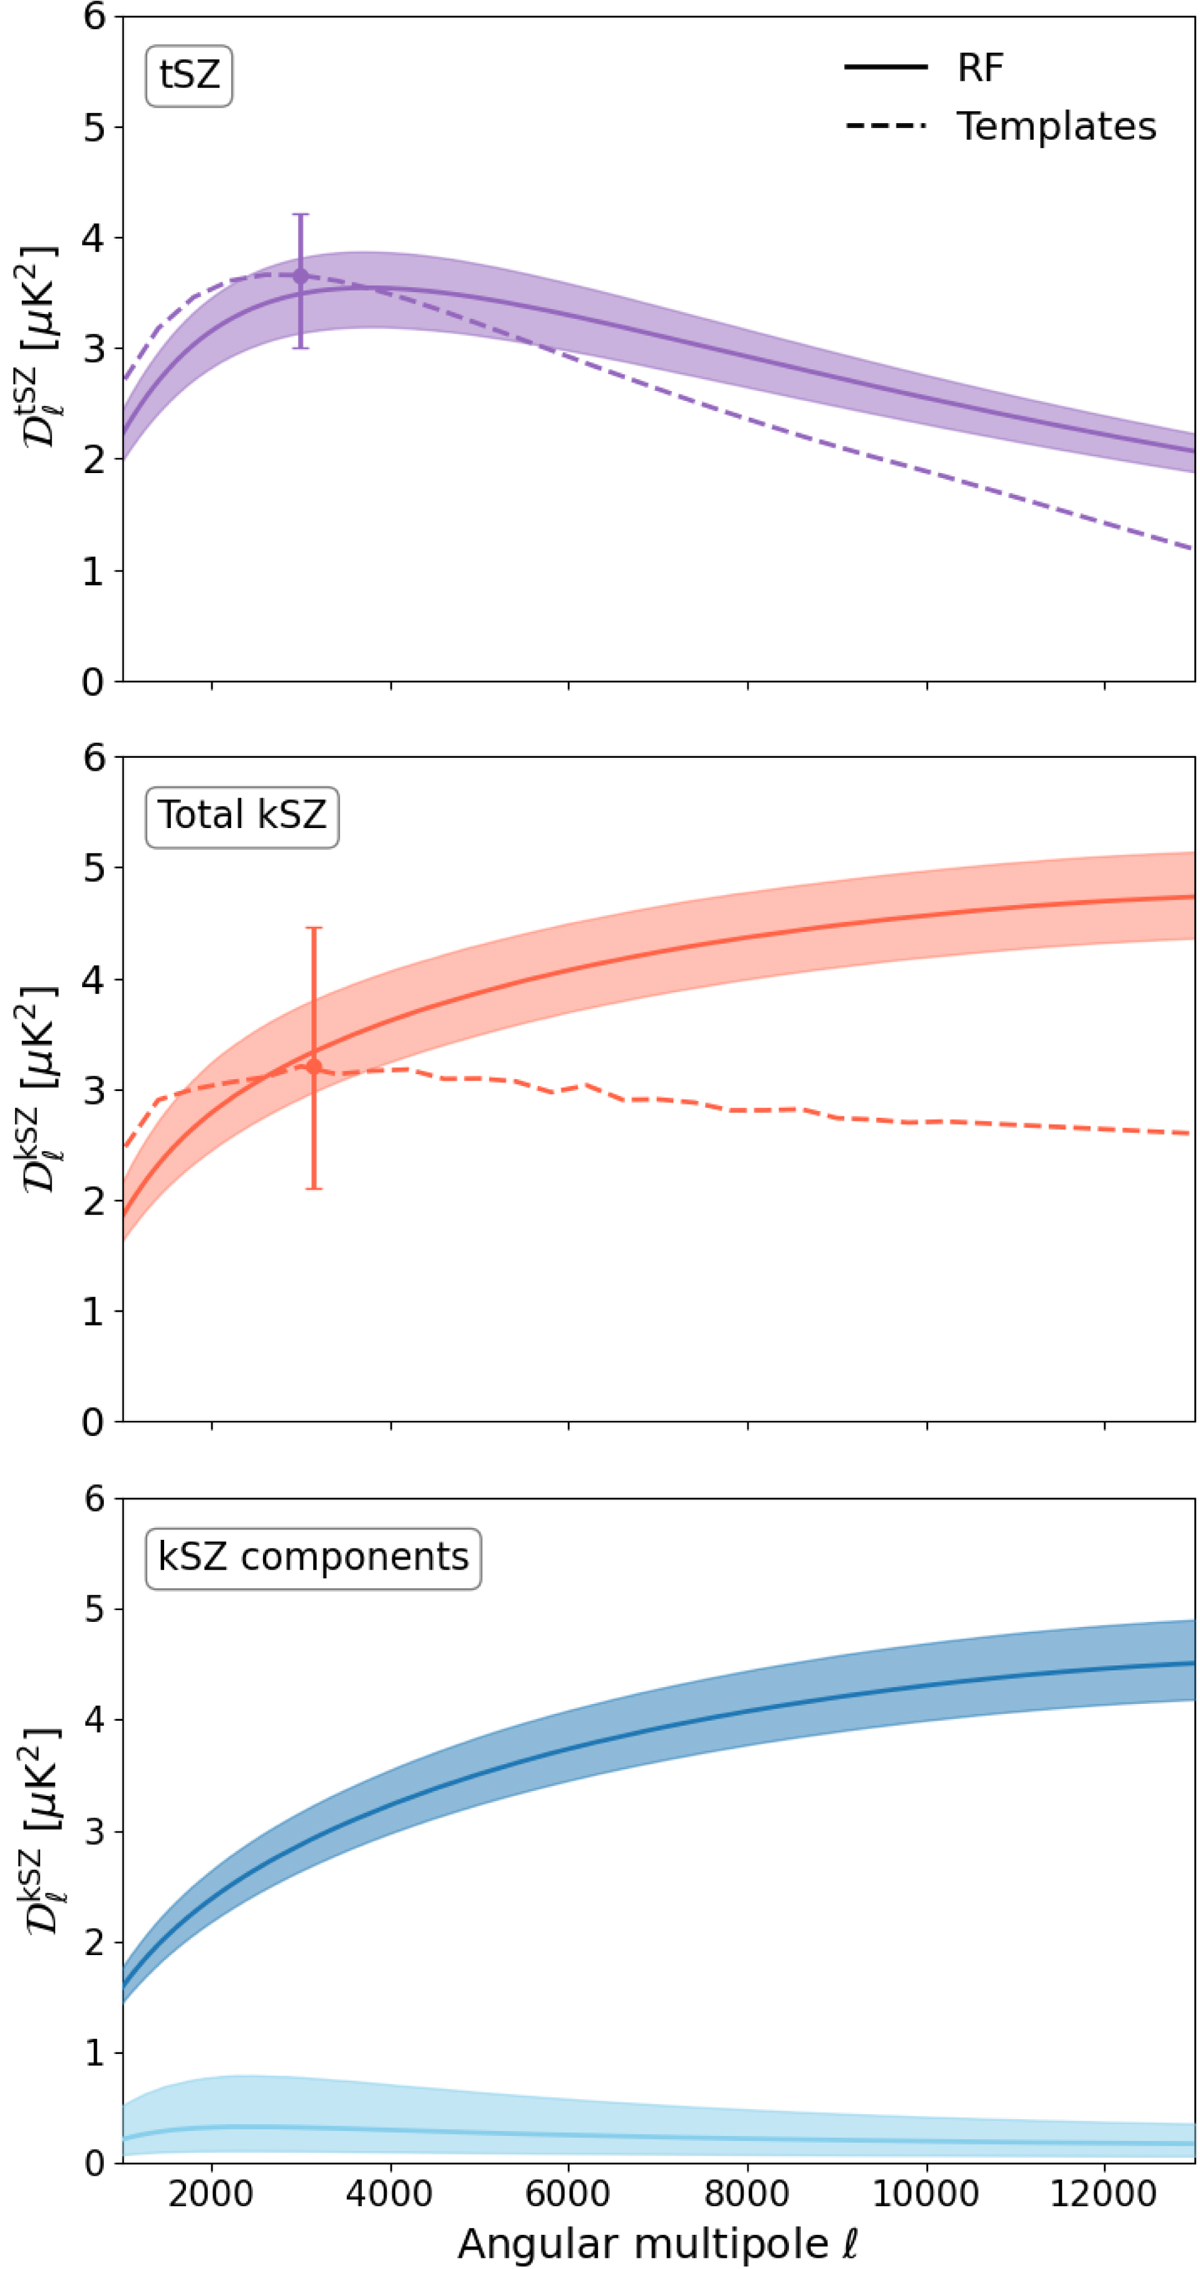
Most likely SZ spectra at 150 GHz obtained when fitting cosmology and reionisation parameters to the SPT data. Two cases are compared: Either templates are used for both spectra (dashed lines) or they are predicted by our RF given the sampled parameters (solid lines). For the results obtained with RF predictions, shaded areas correspond to 68% confidence regions. For the results obtained with templates, only the amplitudes at ℓ = 3000 are constrained, and the 68% confidence intervals on their values are shown as error bars. The tSZ and total kSZ spectra are shown in the upper and middle panels, respectively. When possible, the kSZ signal is decomposed between patchy (dark blue) and late-time (light blue) components, shown in the lower panel.
Current usage metrics show cumulative count of Article Views (full-text article views including HTML views, PDF and ePub downloads, according to the available data) and Abstracts Views on Vision4Press platform.
Data correspond to usage on the plateform after 2015. The current usage metrics is available 48-96 hours after online publication and is updated daily on week days.
Initial download of the metrics may take a while.