Fig. 9
Download original image
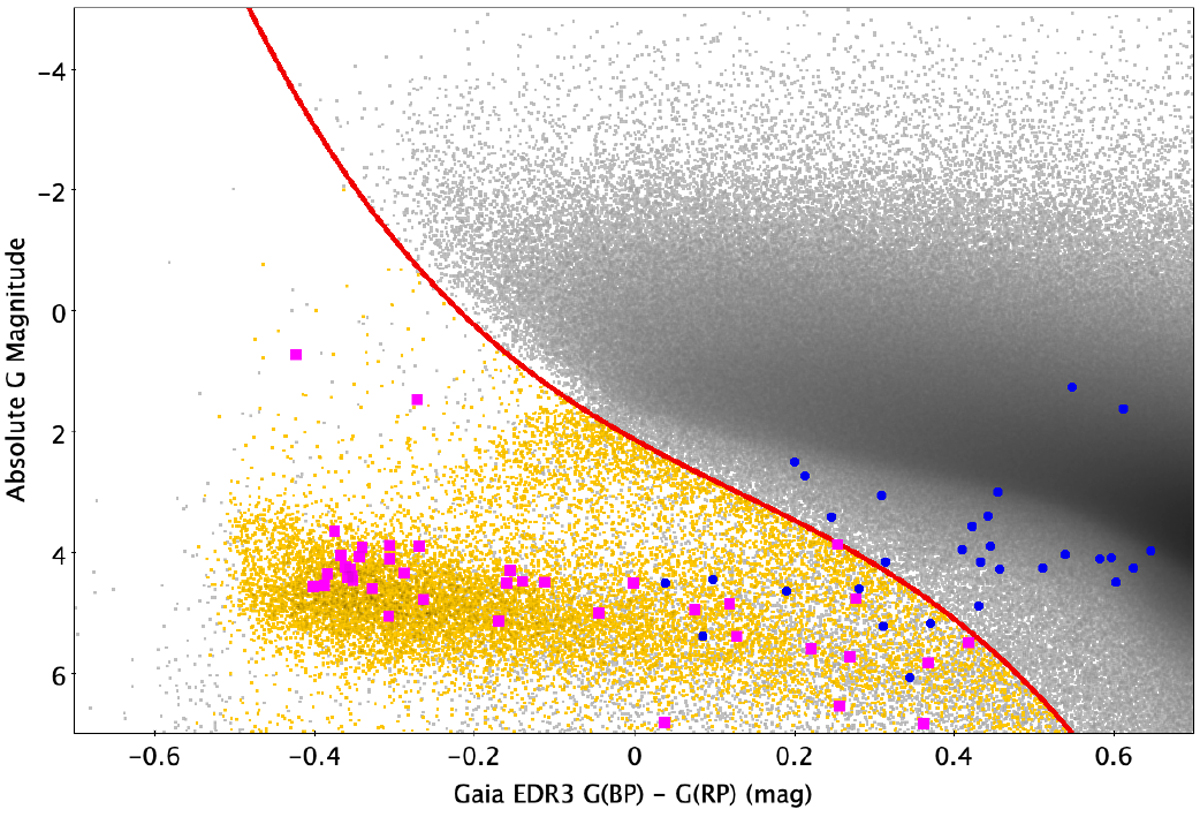
Gaia EDR3 colour-magnitude diagram for the hot subluminous star region showing the initial parallax selection (grey dots), Final Parallax Selection (yellow circles), known hot subdwarfs in wide binary systems displaying an excess in flux error (blue circles), and known hot subdwarfs in close binary systems that display an excess in flux error (magenta squares). The red lines show the variability cutoffs used.
Current usage metrics show cumulative count of Article Views (full-text article views including HTML views, PDF and ePub downloads, according to the available data) and Abstracts Views on Vision4Press platform.
Data correspond to usage on the plateform after 2015. The current usage metrics is available 48-96 hours after online publication and is updated daily on week days.
Initial download of the metrics may take a while.