Fig. 4
Download original image
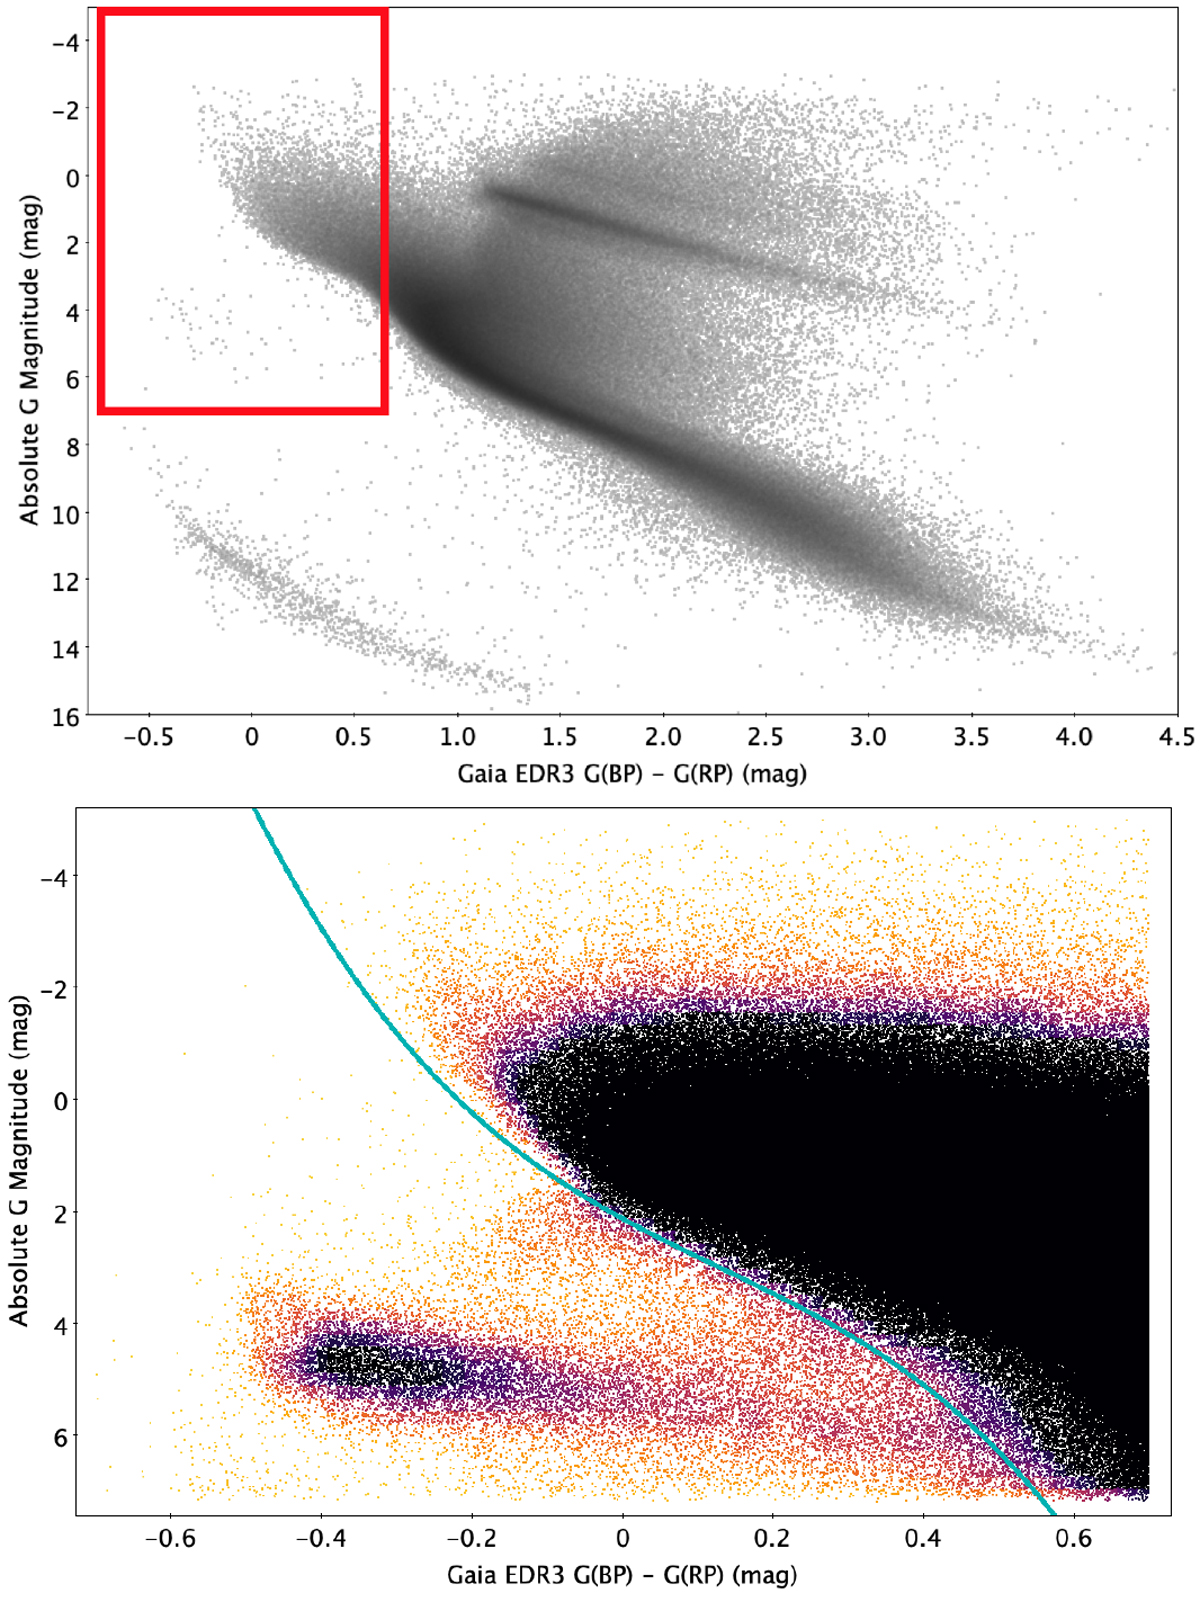
Gaia EDR3 Colour magnitude diagram (CMD). Upper panel: full-scale Gaia EDR3 CMD (grey dots) with the Gaia EDR3 initial hot subluminous star CMD range (red rectangle) used in subsequent CMD plots; lower panel Gaia EDR3 initial hot subluminous star CMD region. The colour scale shows the number density of objects. The cyan line shows the cutoff used to remove the main sequence region.
Current usage metrics show cumulative count of Article Views (full-text article views including HTML views, PDF and ePub downloads, according to the available data) and Abstracts Views on Vision4Press platform.
Data correspond to usage on the plateform after 2015. The current usage metrics is available 48-96 hours after online publication and is updated daily on week days.
Initial download of the metrics may take a while.