Fig. 10
Download original image
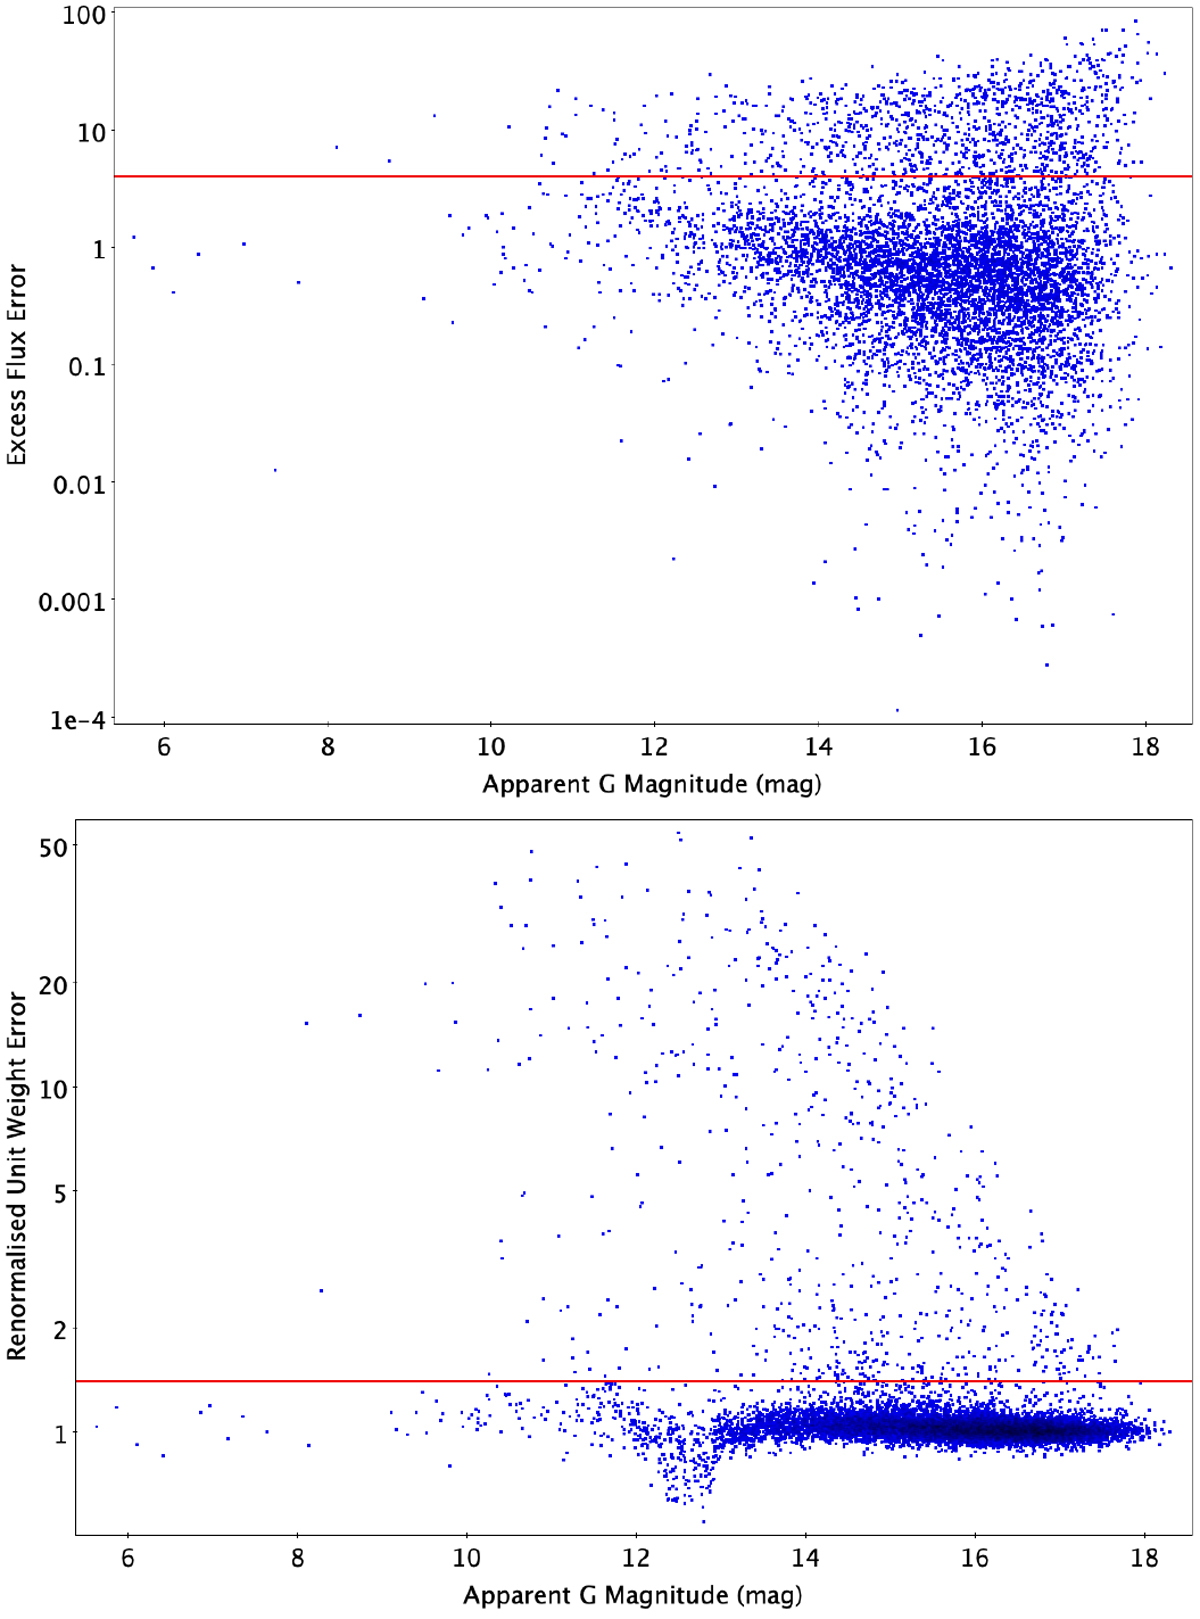
Astrometric and photometric fluctuation indicators versus absolute G magnitude. Upper panel: distribution of excess flux error versus apparent G magnitude for all sources in the final parallax selection. The horizontal red line shows the cutoff used as the limit for variability detection. Lower panel: distribution of re-normalised unit weight error versus apparent G magnitude for all sources in the final parallax selection. The horizontal red line shows the cutoff used as the limit for variability detection.
Current usage metrics show cumulative count of Article Views (full-text article views including HTML views, PDF and ePub downloads, according to the available data) and Abstracts Views on Vision4Press platform.
Data correspond to usage on the plateform after 2015. The current usage metrics is available 48-96 hours after online publication and is updated daily on week days.
Initial download of the metrics may take a while.