Fig. 5.
Download original image
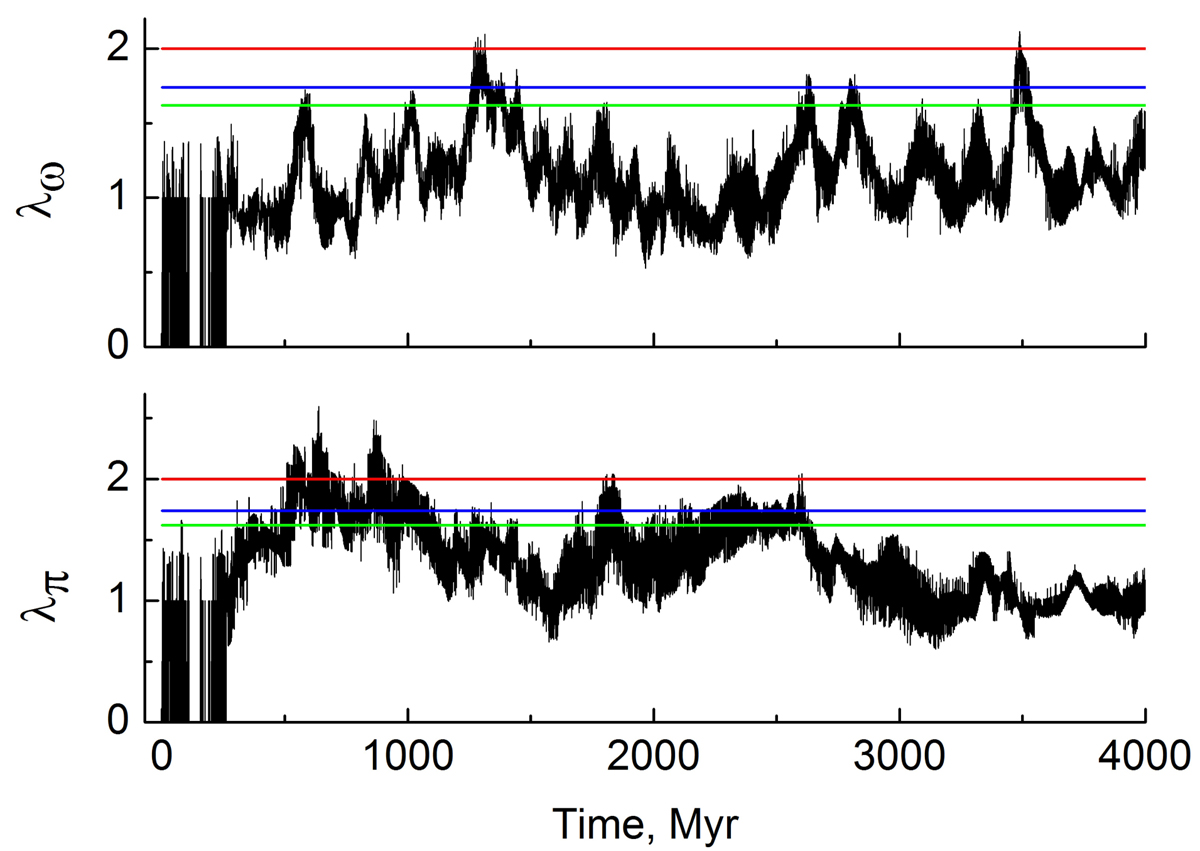
Evolution of λπ and λω for objects with q* > 40 au, a* > 150 au in the case with Md = 40 ME. The data are given with an interval of 200 thousand years. The horizontal colored lines show the values of λ corresponding to the probabilities p = 0.99 (red line), p = 0.95 (blue line), p = 0.9 (green line) that the hypothesis of a uniform distribution is rejected.
Current usage metrics show cumulative count of Article Views (full-text article views including HTML views, PDF and ePub downloads, according to the available data) and Abstracts Views on Vision4Press platform.
Data correspond to usage on the plateform after 2015. The current usage metrics is available 48-96 hours after online publication and is updated daily on week days.
Initial download of the metrics may take a while.