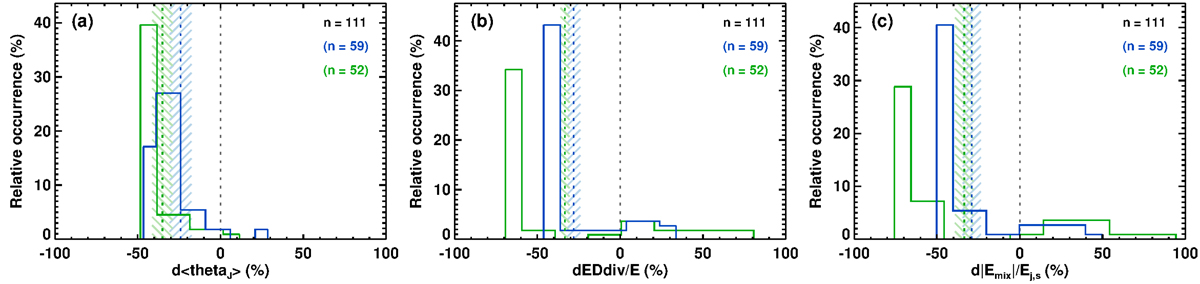
Fig. 6.
Download original image
Histograms displaying the variations of the NLFF model quality as quantified by panel a: ⟨θJ⟩; panel b: Ediv/E; and panel c: |Emix|/EJ, s. Relative differences between the bin1-based estimates and the bin2-(blue) and bin4-based (green) modeling are shown. The total number of considered (qualifying) NLFF models is indicated in black and is used as the basis to compute percentages. The total number of qualifying solutions at bin2 and bin4 are indicated in blue and green, respectively. Median values and median absolute deviation derived from the histograms are shown as dashed vertical lines and shaded bars, respectively.
Current usage metrics show cumulative count of Article Views (full-text article views including HTML views, PDF and ePub downloads, according to the available data) and Abstracts Views on Vision4Press platform.
Data correspond to usage on the plateform after 2015. The current usage metrics is available 48-96 hours after online publication and is updated daily on week days.
Initial download of the metrics may take a while.