Fig. 7
Download original image
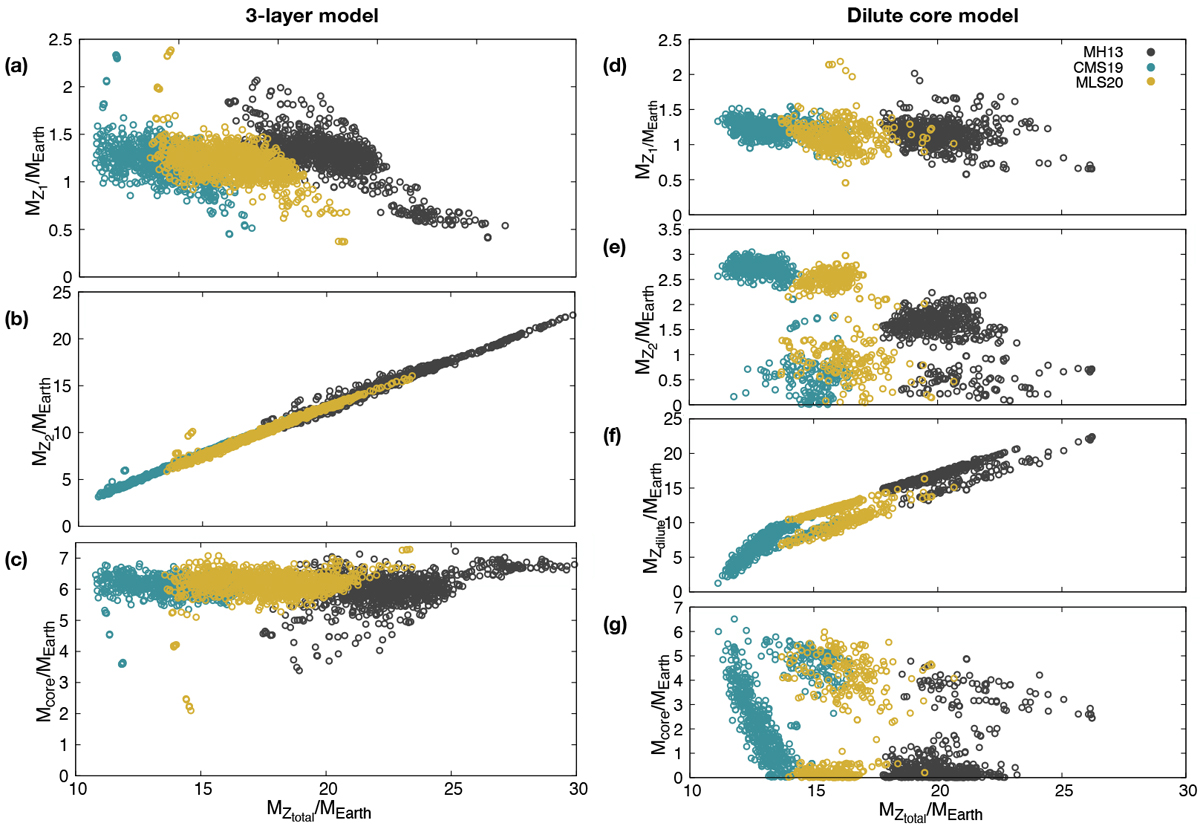
Mass of heavy elements in the different layers as a function of the total mass of heavy elements in Jupiter for a random sample of 1000 models extracted from our three-layer models (a, b, and c) and from models with a dilute core (d, e, f, and g). Different colours show models calculated with different equations of state. Panels a and d show the mass in the H2-dominated region in the y-axis, panels b and e show the mass in the Hmetallic-dominated region, panel f shows the mass in the dilute core, and panels c and g show the mass in the inner core.
Current usage metrics show cumulative count of Article Views (full-text article views including HTML views, PDF and ePub downloads, according to the available data) and Abstracts Views on Vision4Press platform.
Data correspond to usage on the plateform after 2015. The current usage metrics is available 48-96 hours after online publication and is updated daily on week days.
Initial download of the metrics may take a while.