Fig. 4
Download original image
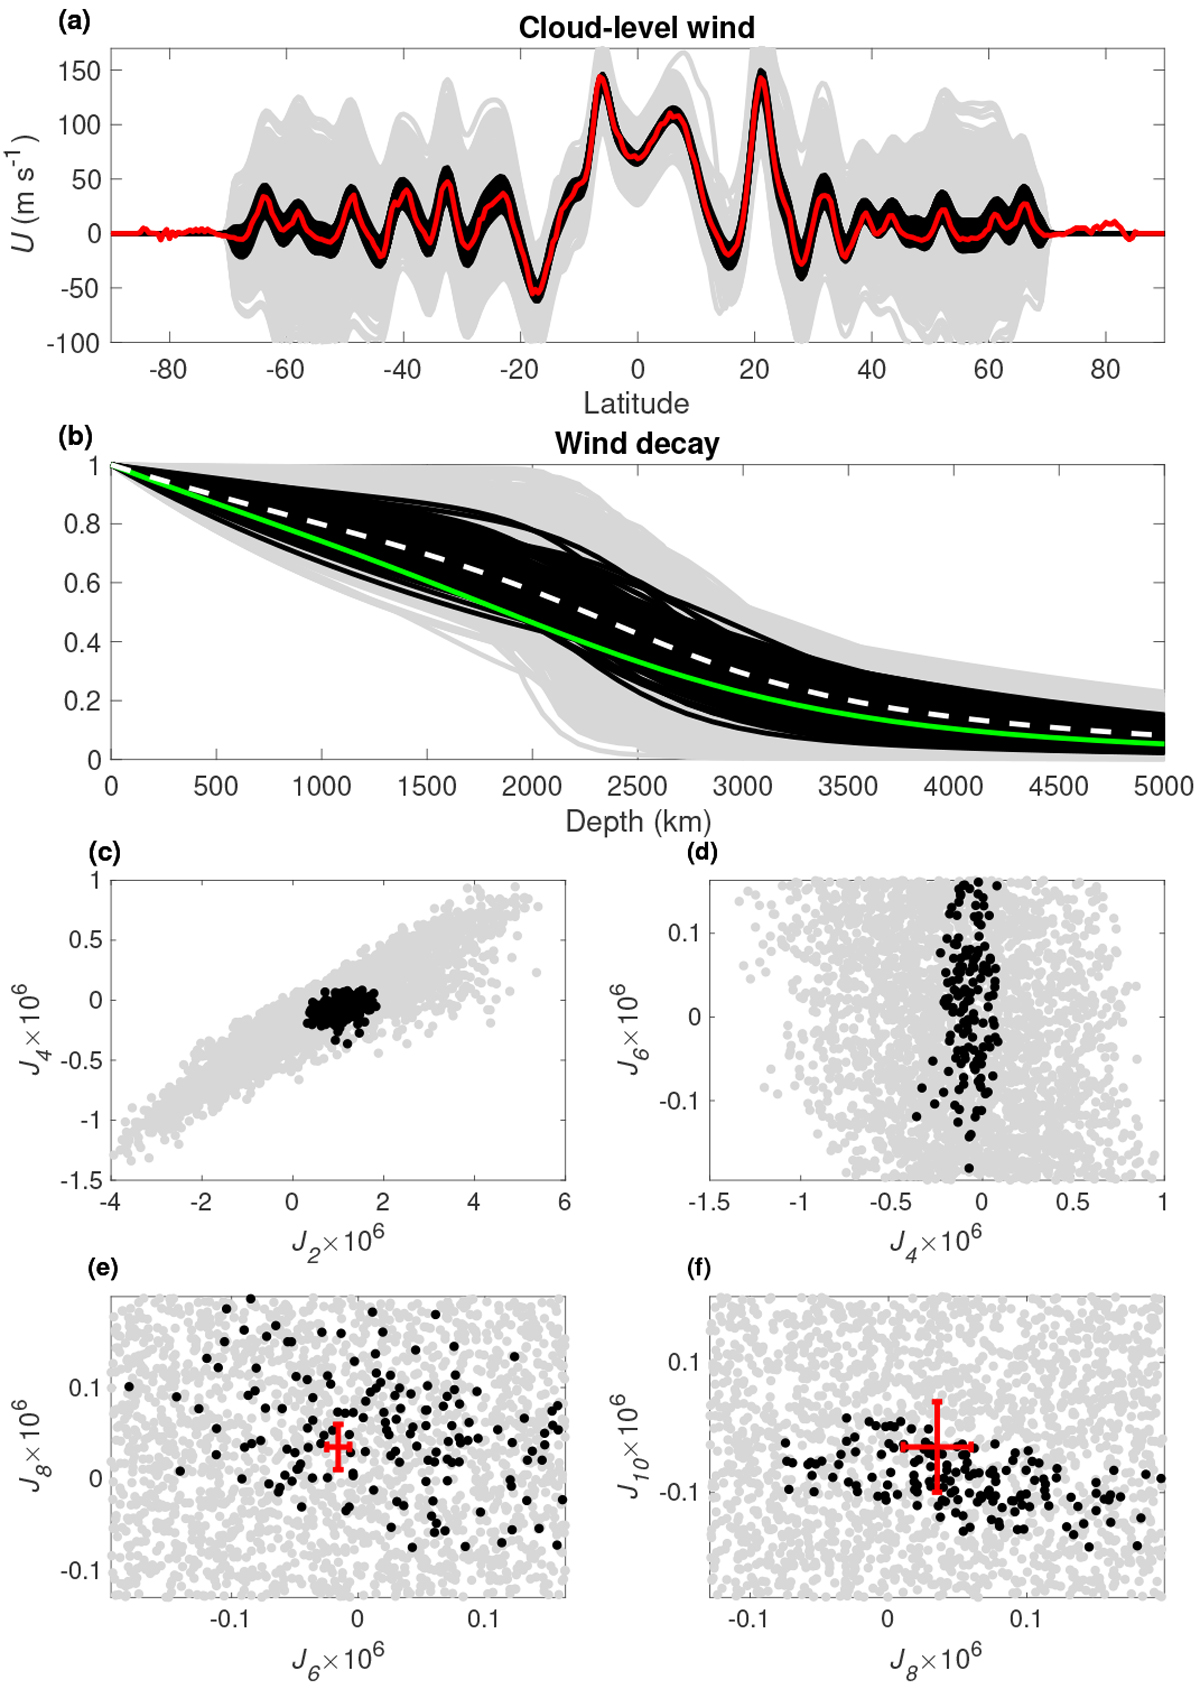
Contribution to the gravity harmonics from the deep atmospheric flow. Shown are the solutions for the cloud-level wind (a), the radial decay profile (b), and the wind-induced even gravity harmonics (c-f). The grey lines and dots show all of the 3000 cases, and the black lines and dots show the plausible solutions. The red line in (a) shows the observed cloud-level wind, and the green line in (b) shows the solution in Kaspi et al. (2018). The red crosses in (e-f) show the expected mean value of the differential contribution.
Current usage metrics show cumulative count of Article Views (full-text article views including HTML views, PDF and ePub downloads, according to the available data) and Abstracts Views on Vision4Press platform.
Data correspond to usage on the plateform after 2015. The current usage metrics is available 48-96 hours after online publication and is updated daily on week days.
Initial download of the metrics may take a while.