Fig. 3
Download original image
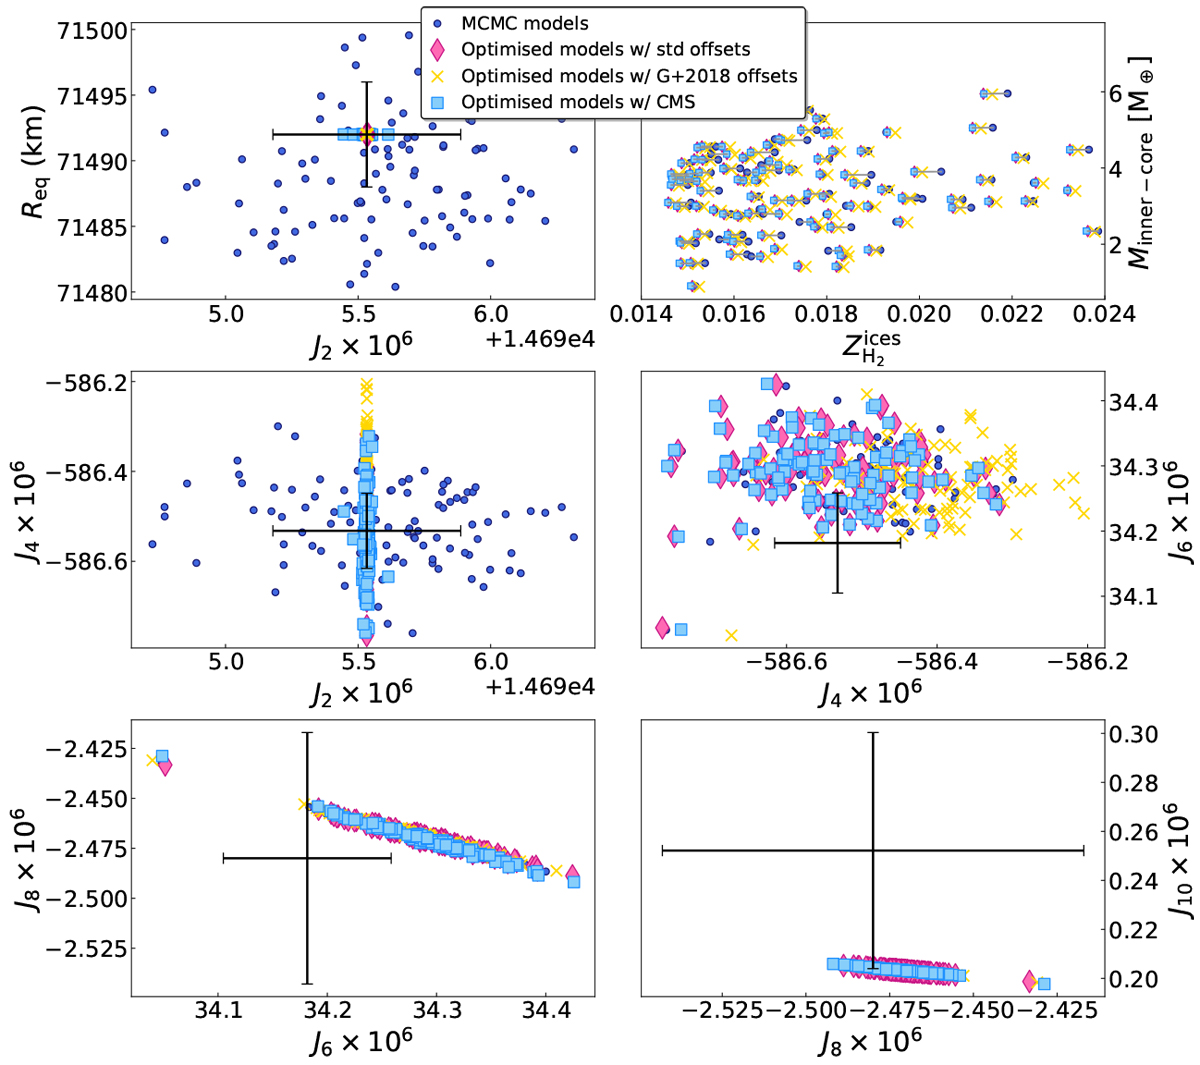
Results for four sets of 100 models: random models from our preferred MCMC runs, optimised models with new offsets, optimised models with former offsets from Guillot et al. (2018), and optimised models with CMS calculation. Top left panel: equatorial radius vs. J2. Top right panel: core mass vs. fraction of ices in the molecular hydrogen layer. Grey lines show the pairing between each model and its optimised version. Middle and bottom panels: gravitational moments. The black error bars show the uncertainty of the Juno measurements that account for the differential rotation.
Current usage metrics show cumulative count of Article Views (full-text article views including HTML views, PDF and ePub downloads, according to the available data) and Abstracts Views on Vision4Press platform.
Data correspond to usage on the plateform after 2015. The current usage metrics is available 48-96 hours after online publication and is updated daily on week days.
Initial download of the metrics may take a while.