Fig. 3
Download original image
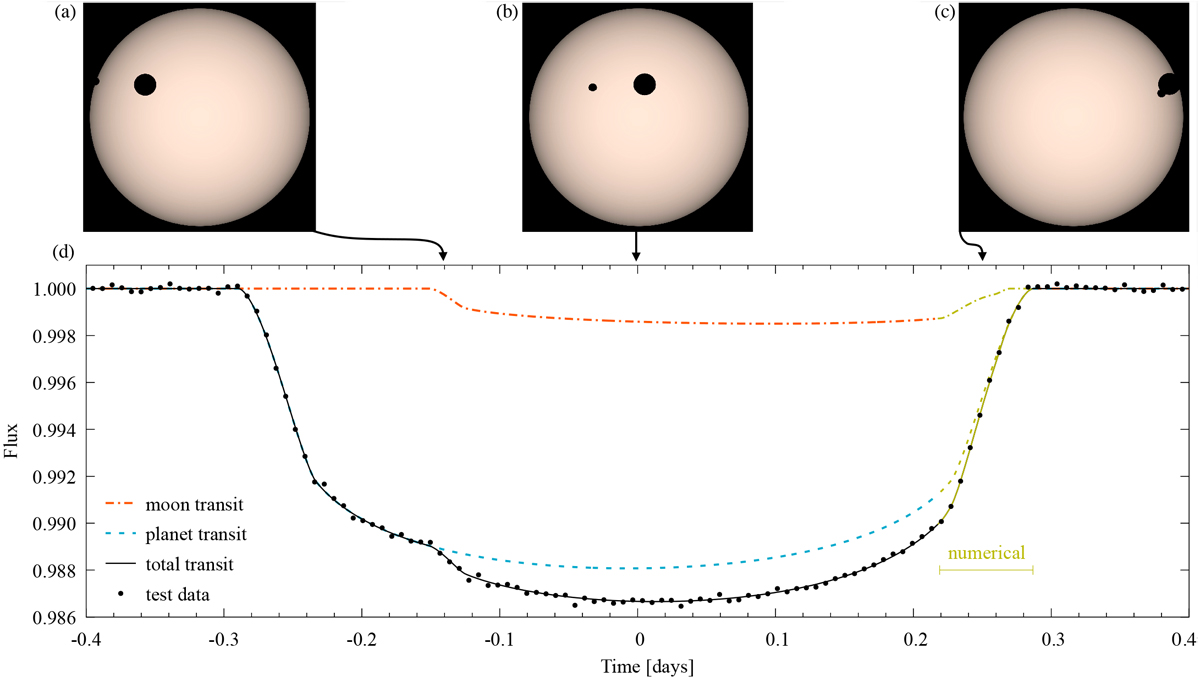
Output demo of Pandora for a system of a Sun-like star, a Jupiter-sized planet in a one-year orbit around that star, and a Neptune-sized moon in a 1.28 days orbit around the giant planet (for details see Sect. 3.2). (a)–(c) Video renderings of the transit. (d) Light curve. The dotted-dashed orange line shows the transit light curve of the exomoon and the dashed blue line shows the transit light curve of the exoplanet using the analytical solution in both cases. The yellow parts of the moon and planet light curves illustrate numerical simulations. The solid black line shows the combined model. Black dots show a simulated observation roughly representative of an mV ~ 11 Sun-like star from the PLATO mission. Digital star colors are from Harre & Heller (2021).
Current usage metrics show cumulative count of Article Views (full-text article views including HTML views, PDF and ePub downloads, according to the available data) and Abstracts Views on Vision4Press platform.
Data correspond to usage on the plateform after 2015. The current usage metrics is available 48-96 hours after online publication and is updated daily on week days.
Initial download of the metrics may take a while.