Fig. 7
Download original image
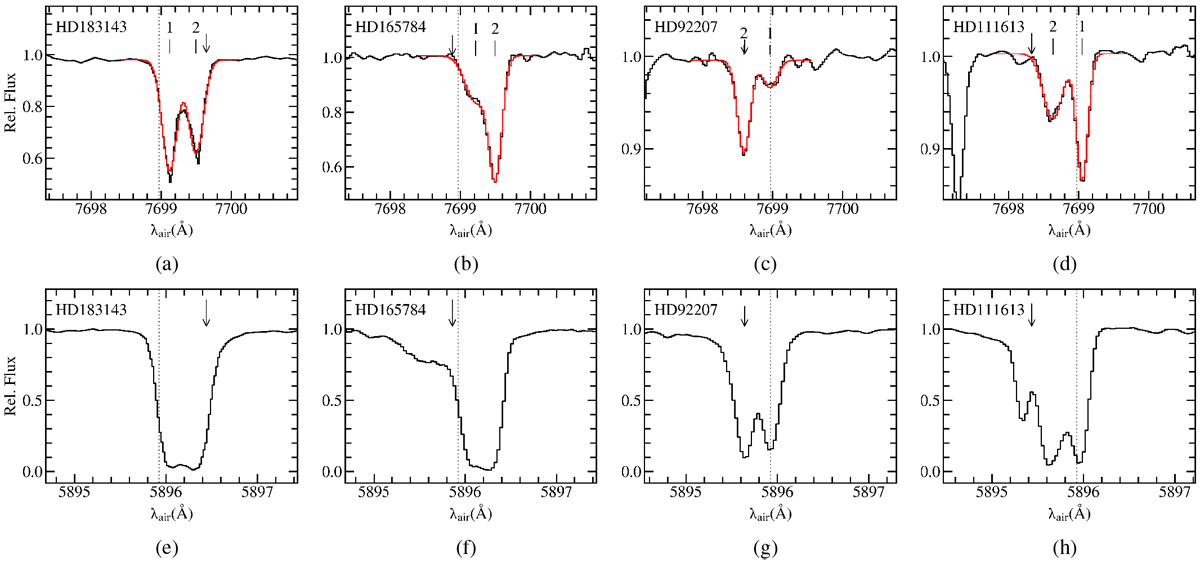
Spectra of atomic ISM lines. Upper panels: observed spectra (black) of the interstellar K I line at λair = 7698.965 Å fitted with a two-Gaussian absorption model (red). Component numbers are indicated. The vertical dotted lines represent the laboratory wavelengths of the K I lines. The strong line at about λair = 9697.3 Å in panel d is a telluric O2 line. Lower panels: observed spectra (black) of the Na I D1 line at λair = 5895.924 Å (vertical dotted). For the cooler stars, HD 165784 and HD 111613, the interstellar Na I D1 lines are blended with a stellar component. The third Na I component at ~5895.3 Å in panel h is very weak compared to the other two and barely present in K I, such that it is neglected for the RV analysis as little DIB absorption can be expected to originate from it. The position of the K I and Na I line in the stellar rest frame is indicated by a vertical arrow. Wavelengths are in the LSR.
Current usage metrics show cumulative count of Article Views (full-text article views including HTML views, PDF and ePub downloads, according to the available data) and Abstracts Views on Vision4Press platform.
Data correspond to usage on the plateform after 2015. The current usage metrics is available 48-96 hours after online publication and is updated daily on week days.
Initial download of the metrics may take a while.