Fig. 8.
Download original image
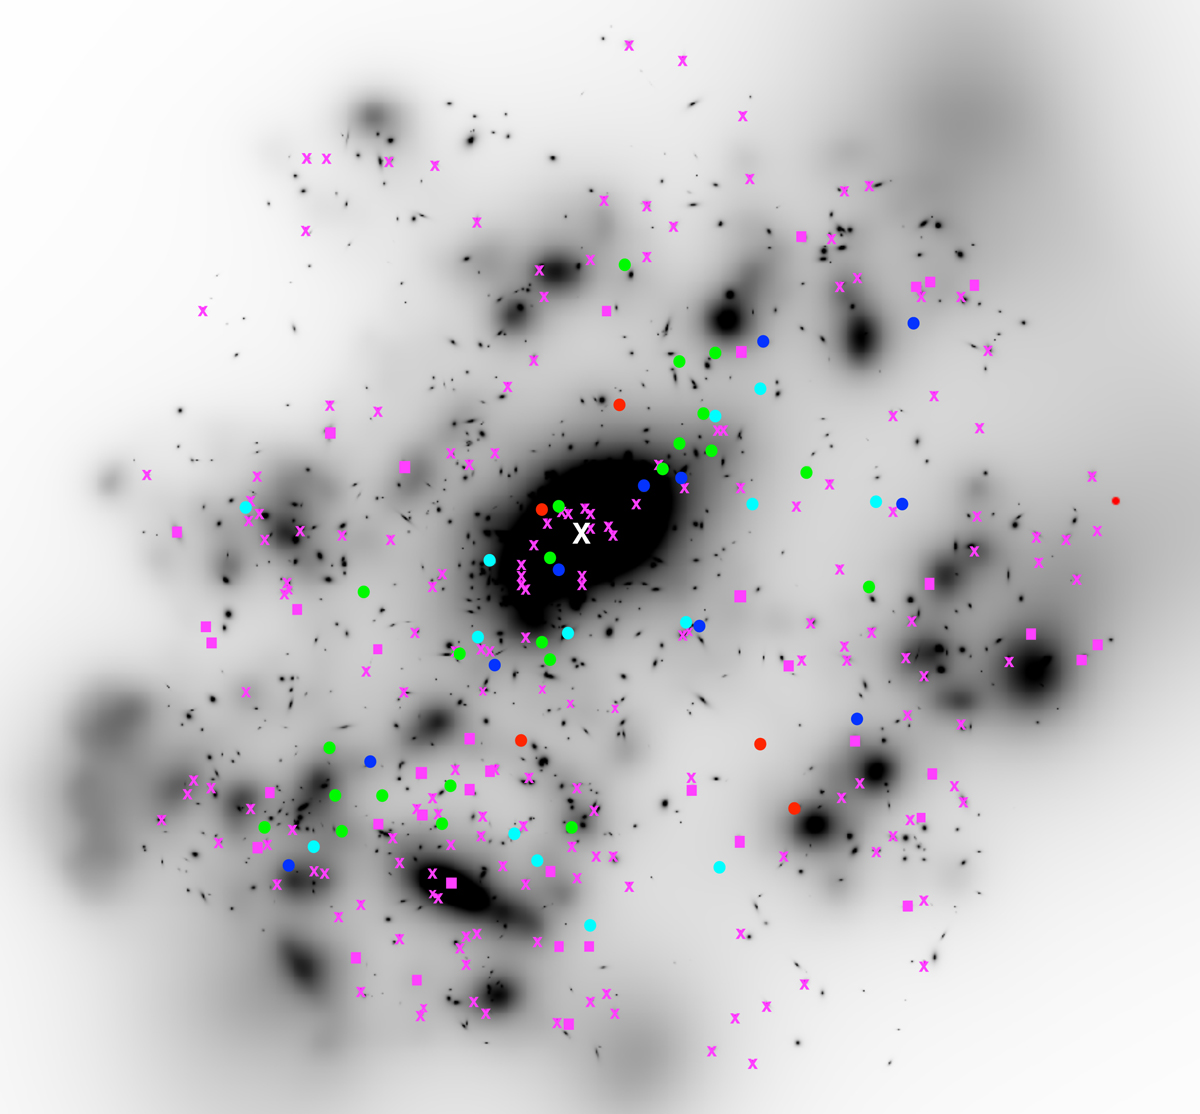
Figure 4 from Tam et al. (2020) showing the large scale-structure in a total region of 30 × 30 arcmin2 around MS 0451. The positions of RPS candidates of Samples 1a, 1b, 1c, and 1d are respectively shown as green, cyan, blue and red circles. The RPS candidates of Sample 2 with grades J = 1 to 3 are shown as magenta crosses, and those with J = 4 and 5 with magenta squares. The white cross indicates the position of the cluster centre. North is up and east is left.
Current usage metrics show cumulative count of Article Views (full-text article views including HTML views, PDF and ePub downloads, according to the available data) and Abstracts Views on Vision4Press platform.
Data correspond to usage on the plateform after 2015. The current usage metrics is available 48-96 hours after online publication and is updated daily on week days.
Initial download of the metrics may take a while.