Open Access
Fig. 4.
Download original image
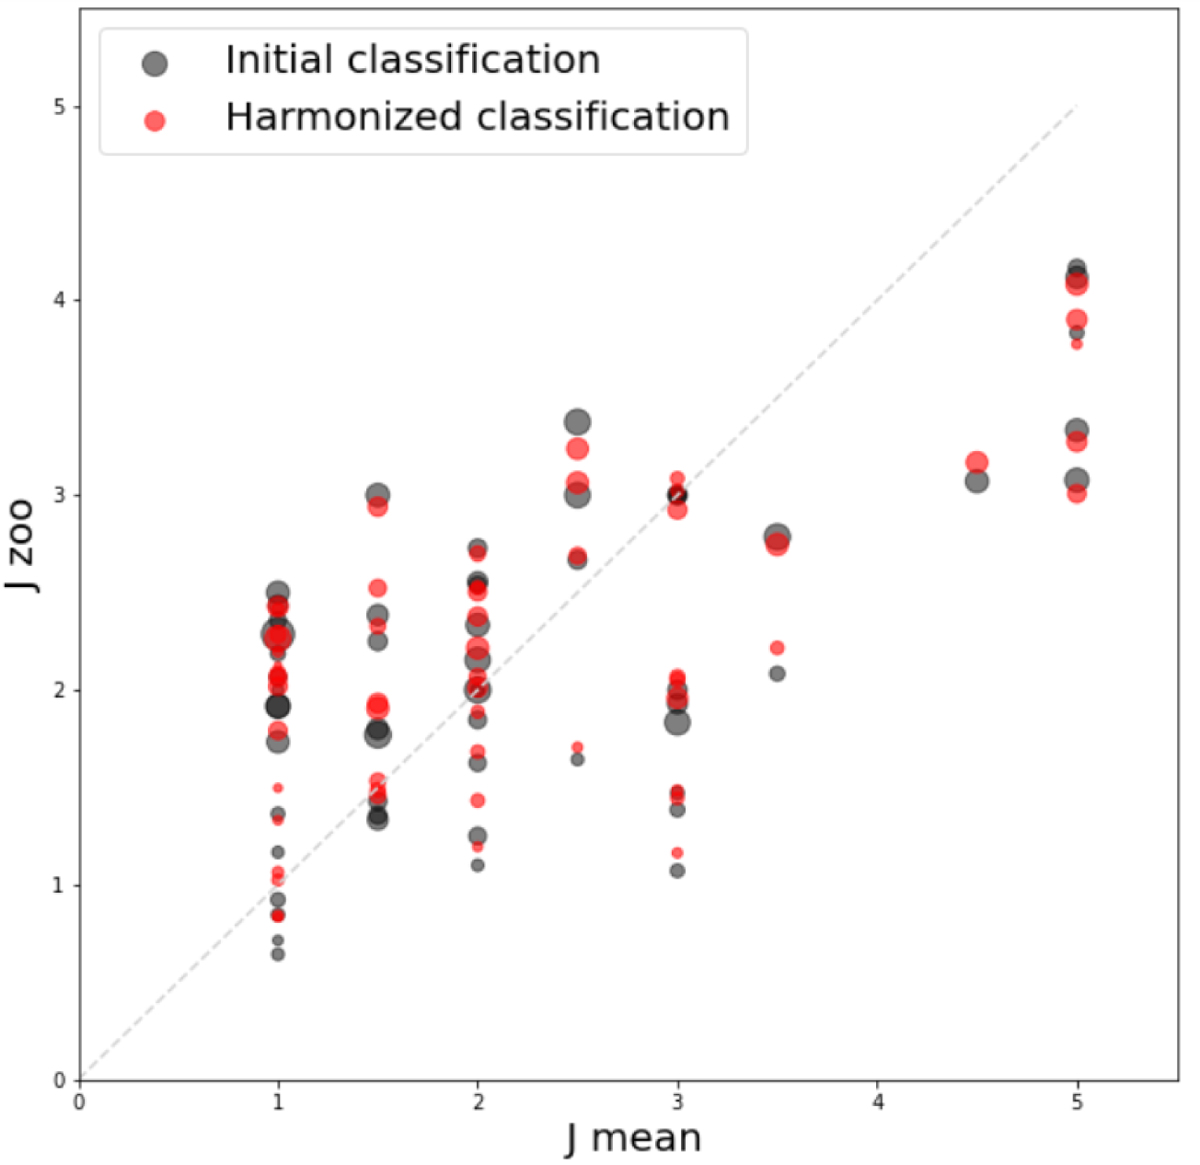
Zooniverse J classification as a function of our mean classification for the 56 RPS candidates of Sample 1. The grey points show the initial classification and the red ones that obtained after harmonizing the classifications. The point sizes increase with the standard deviation on the measurement of J.
Current usage metrics show cumulative count of Article Views (full-text article views including HTML views, PDF and ePub downloads, according to the available data) and Abstracts Views on Vision4Press platform.
Data correspond to usage on the plateform after 2015. The current usage metrics is available 48-96 hours after online publication and is updated daily on week days.
Initial download of the metrics may take a while.