Open Access
Fig. 12.
Download original image
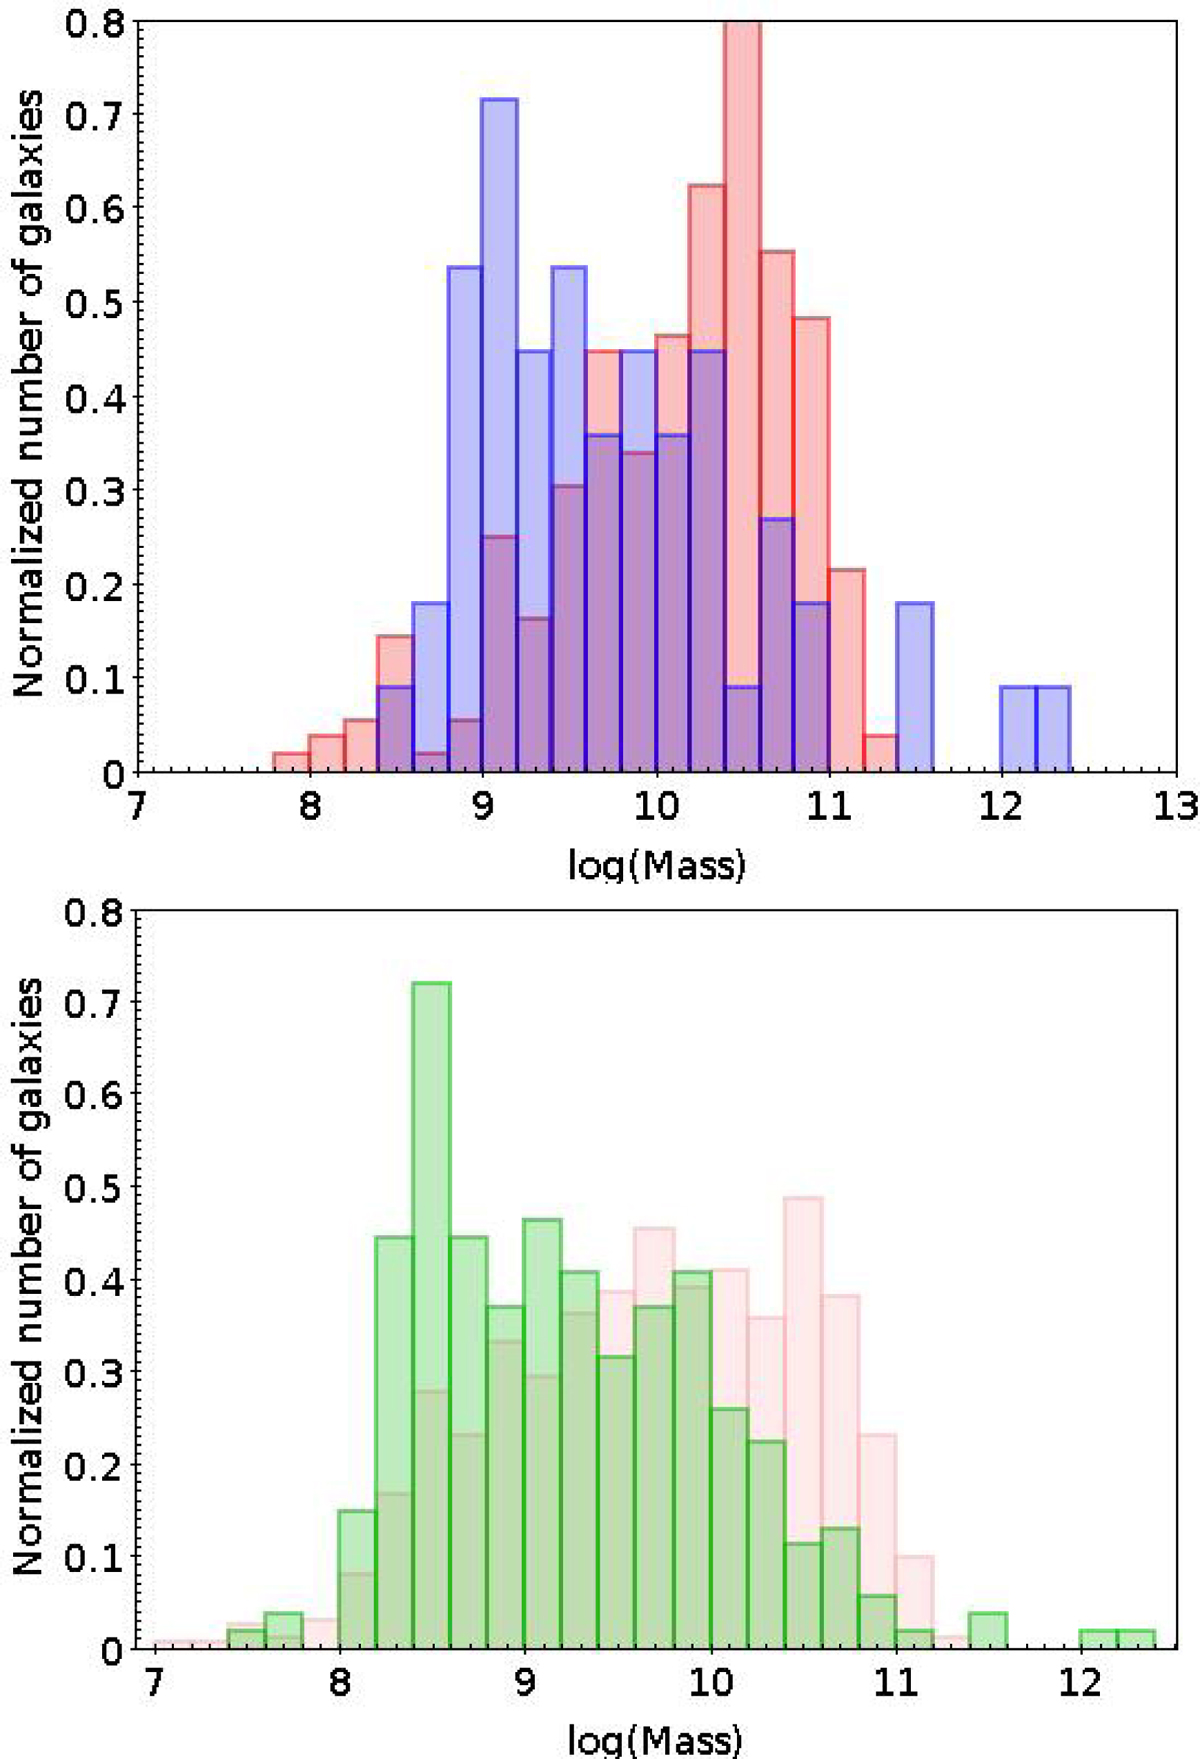
Histograms of the stellar masses (in units of solar masses) normalized to the same area. Top: samples 1 and 3 (spectroscopic redshifts), with RPS candidates in blue and non-RPS galaxies in red. Bottom: samples 2 and 4 (photometric redshifts), with RPS candidates in green and non-RPS galaxies in light pink.
Current usage metrics show cumulative count of Article Views (full-text article views including HTML views, PDF and ePub downloads, according to the available data) and Abstracts Views on Vision4Press platform.
Data correspond to usage on the plateform after 2015. The current usage metrics is available 48-96 hours after online publication and is updated daily on week days.
Initial download of the metrics may take a while.