Fig. 11.
Download original image
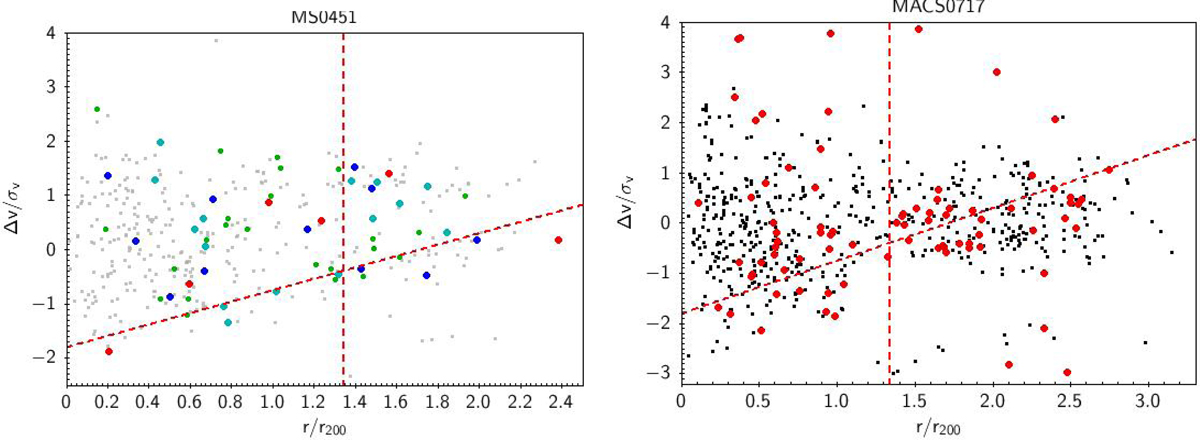
Projected phase space diagrams (see text) for MS 0451 (left) and MACS 0717 (right). For MS 0451, the 359 galaxies with spectroscopic redshifts in the cluster range are in grey, and RPS candidates of samples 1a, 1b, 1c and 1d are respectively shown as small green, large green, blue, and red points. For MACS 0717, all galaxies in the cluster range are in black and RPS candidates are in red. The vertical and oblique dashed lines are those of Fig. 9 of Mahajan et al. (2011) as explained in the text.
Current usage metrics show cumulative count of Article Views (full-text article views including HTML views, PDF and ePub downloads, according to the available data) and Abstracts Views on Vision4Press platform.
Data correspond to usage on the plateform after 2015. The current usage metrics is available 48-96 hours after online publication and is updated daily on week days.
Initial download of the metrics may take a while.