Free Access
Fig. 13.
Download original image
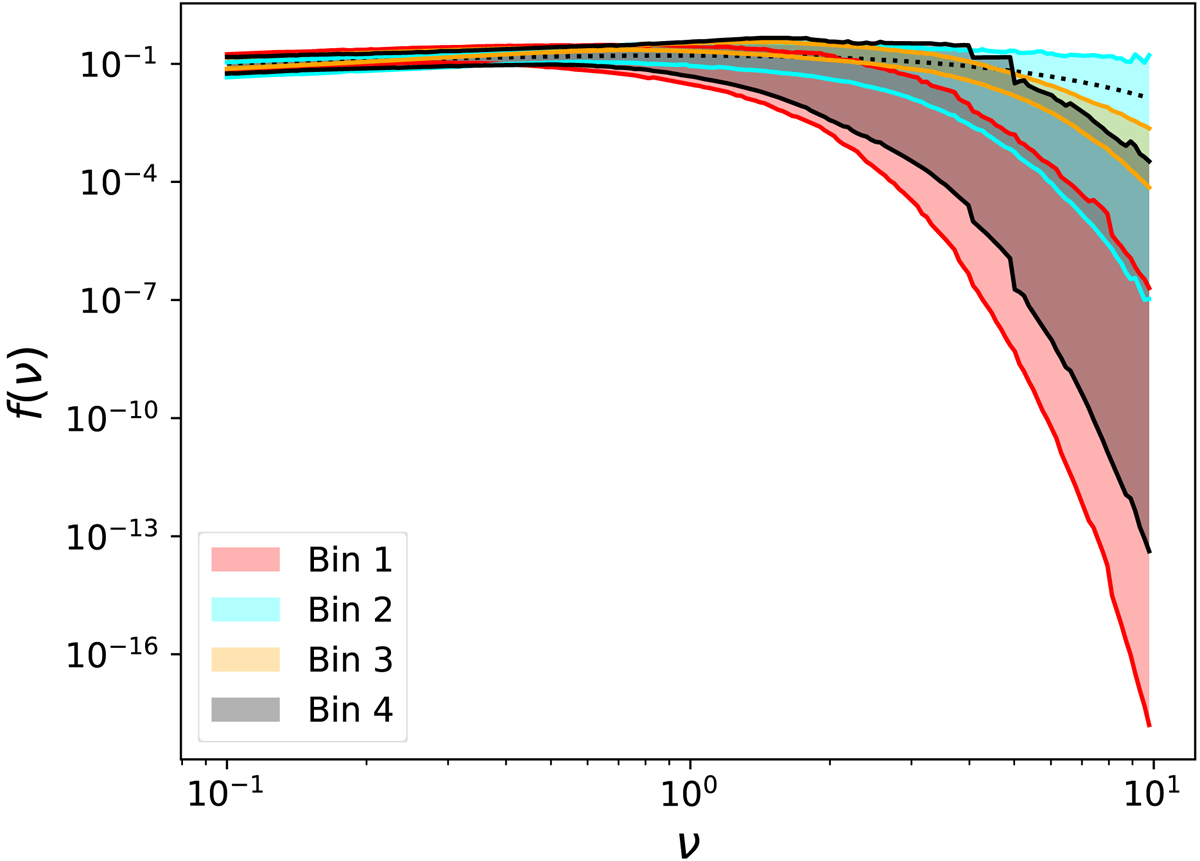
Posterior-sampled f(ν, z) function at different redshift bins. The 68% probability contours are depicted in red, cyan, orange, and black for bins 1 to 4, respectively. The ST best fit by Despali et al. (2016) is plotted with a black dotted line.
Current usage metrics show cumulative count of Article Views (full-text article views including HTML views, PDF and ePub downloads, according to the available data) and Abstracts Views on Vision4Press platform.
Data correspond to usage on the plateform after 2015. The current usage metrics is available 48-96 hours after online publication and is updated daily on week days.
Initial download of the metrics may take a while.