Free Access
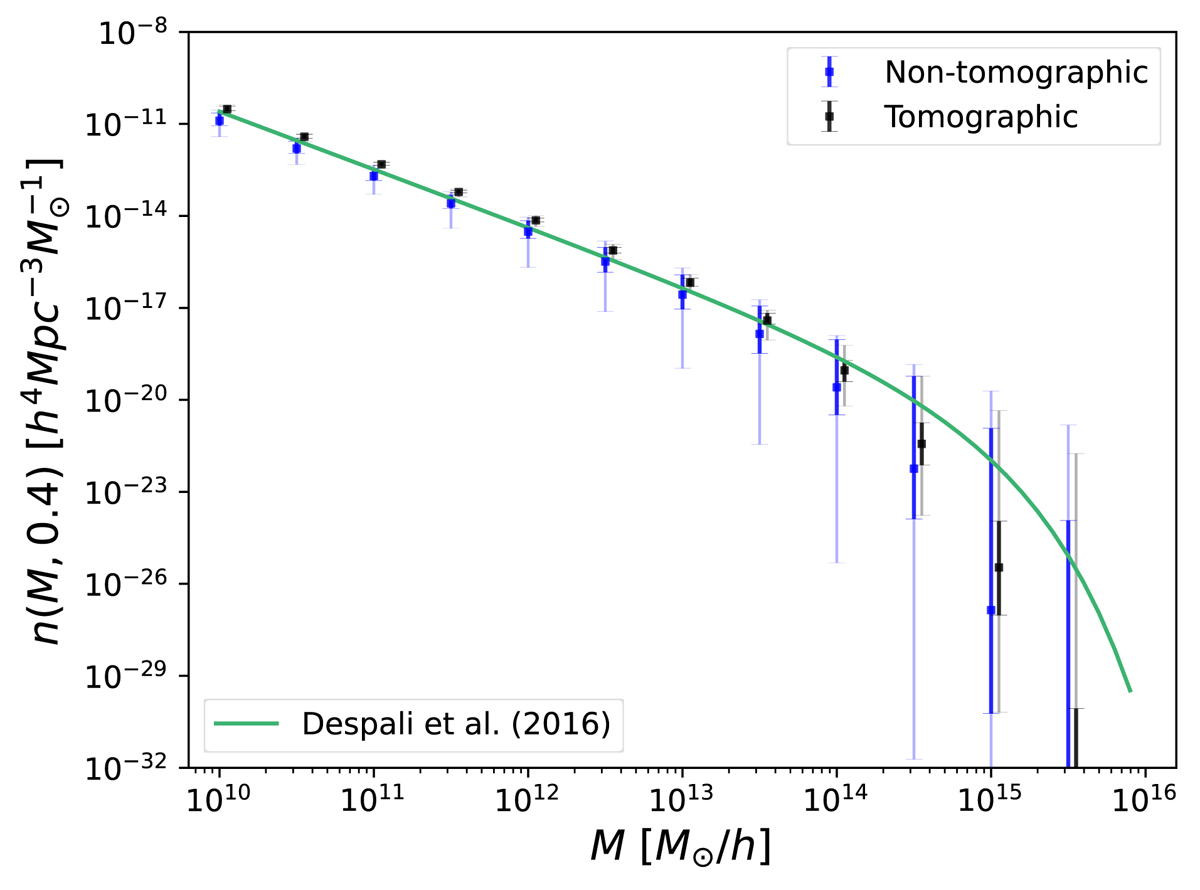
Fig. 10.
Download original image
Credible intervals (68% in bold and 95% in faint colors) for the z = 0.4 HMF at different mass values when the full posterior distribution is sampled in both the non-tomographic (blue) and tomographic (black) cases for the minitiles scheme. The ST best fit by Despali et al. (2016) is drawn with a green line.
Current usage metrics show cumulative count of Article Views (full-text article views including HTML views, PDF and ePub downloads, according to the available data) and Abstracts Views on Vision4Press platform.
Data correspond to usage on the plateform after 2015. The current usage metrics is available 48-96 hours after online publication and is updated daily on week days.
Initial download of the metrics may take a while.