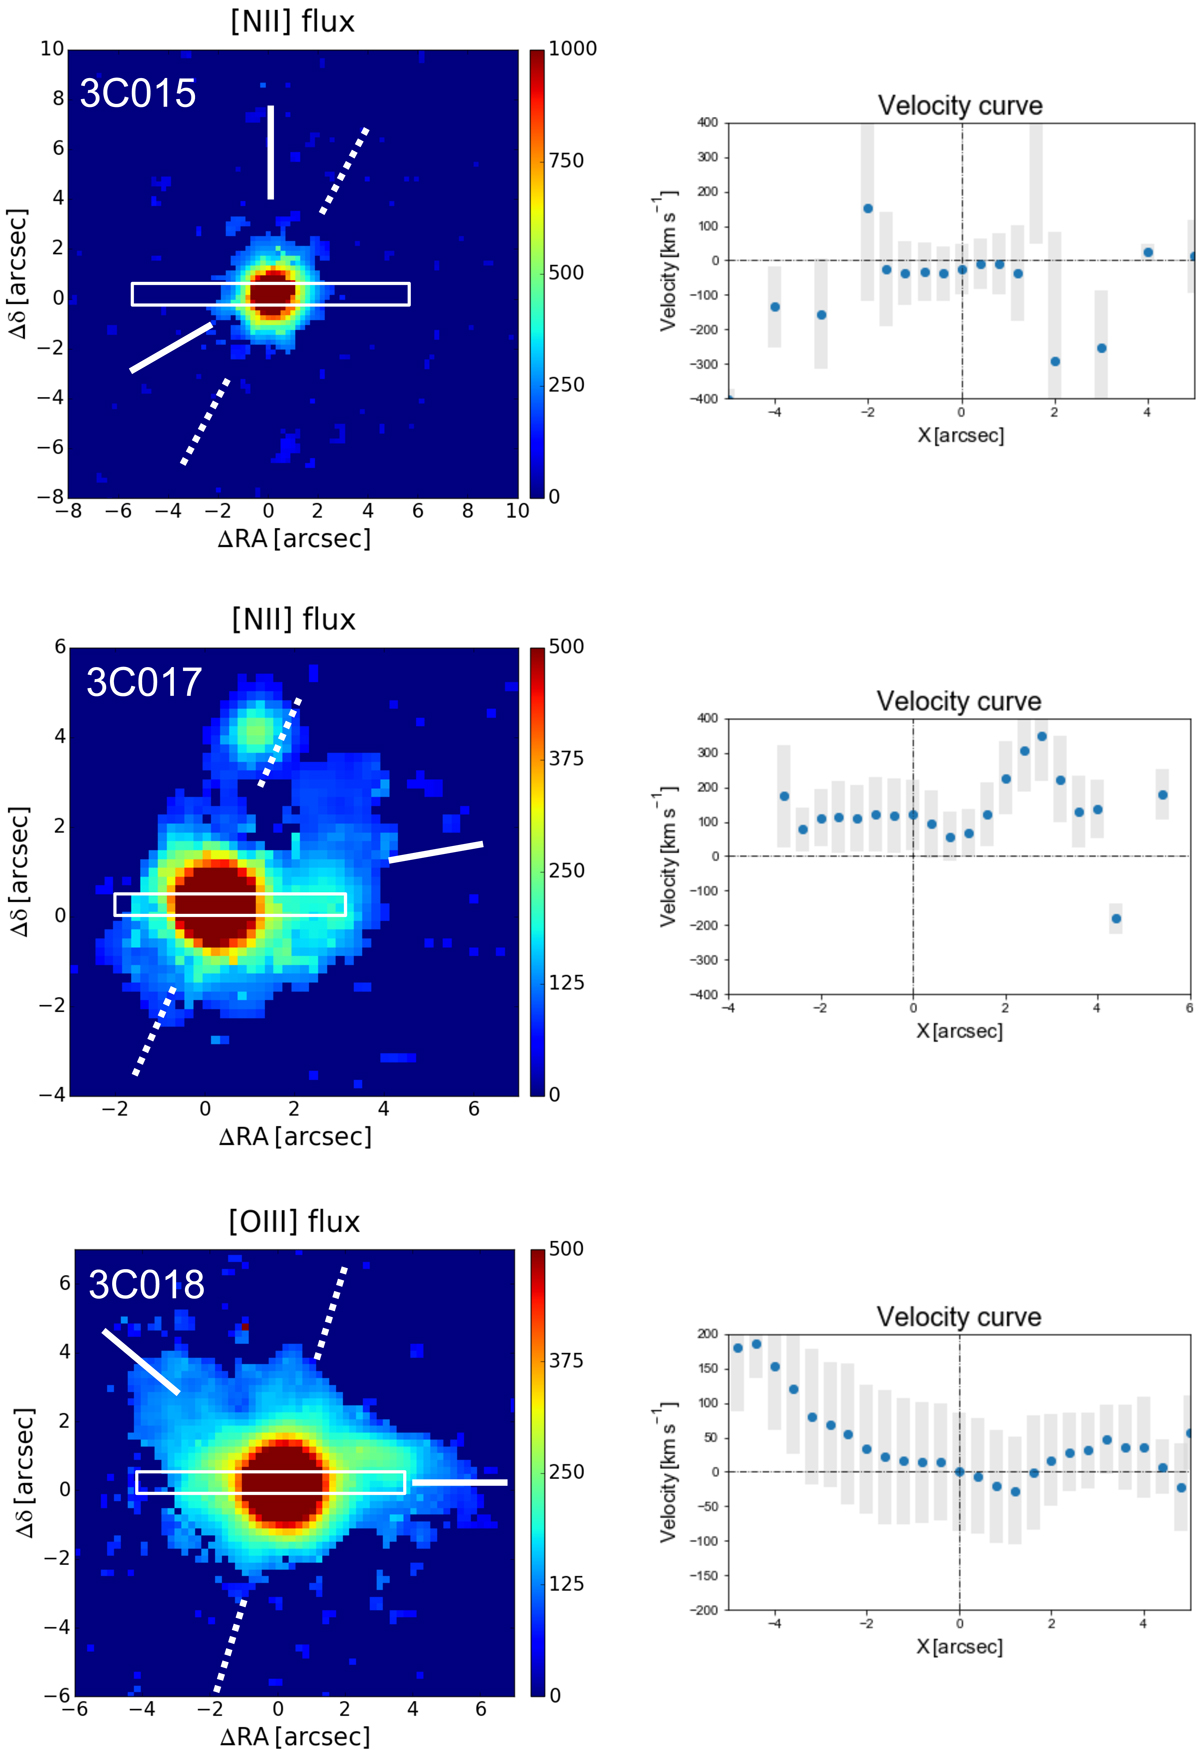
Fig. A.1.
Download original image
Images of the brightest emission line for the 37 radiogalaxies observed with MUSE. The white dotted lines mark the radio position angle, and the solid white lines show the orientation of the emission line structures, when possible, on both sides of the nucleus. The gray line is the orientation of the kinematical major axis in the inner regions measured with kinemetry for all sources with data quality sufficient for a robust measurement (see text for details). The rectangle represents the regions from which we extracted the velocity curve shown in the right panel. The length of the gray bars represents the line width at each location.
Current usage metrics show cumulative count of Article Views (full-text article views including HTML views, PDF and ePub downloads, according to the available data) and Abstracts Views on Vision4Press platform.
Data correspond to usage on the plateform after 2015. The current usage metrics is available 48-96 hours after online publication and is updated daily on week days.
Initial download of the metrics may take a while.