Fig. 4.
Download original image
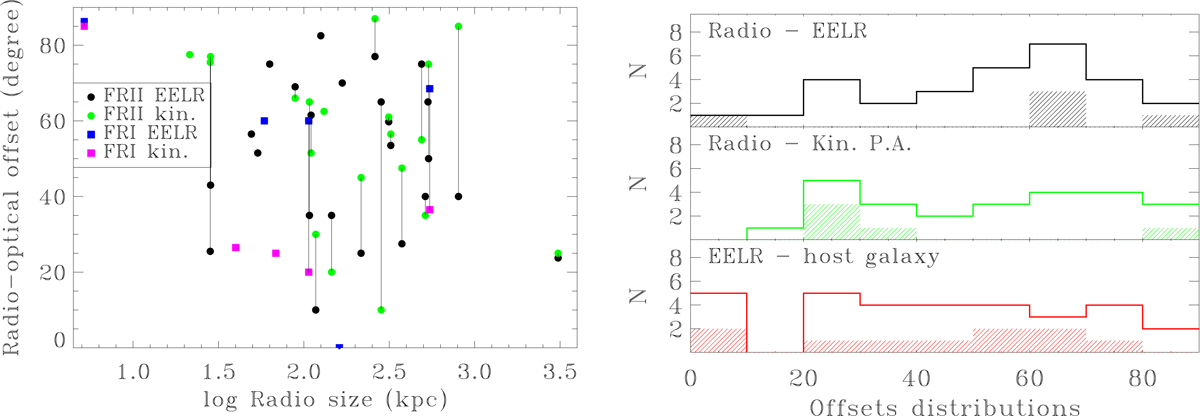
Comparison of the radio and optical axis. Left: offsets between the position angle of the most extended line structure and the radio axis against the LAS of the radio sources. FR Is are marked with blue squares. The green circles are the offsets between the radio and the kinematical axis derived from kinemetry for the FR IIs (magenta squares are for the FR Is). The vertical lines connect the two offsets measurements for the same source when both are available. Right: distributions of the offsets of the radio axis from (top) the emission line structures, averaged between the two sides, (center) the kinematical axis, and (bottom) the host’s major axis. The shaded area of the histograms is the contribution of the FR Is.
Current usage metrics show cumulative count of Article Views (full-text article views including HTML views, PDF and ePub downloads, according to the available data) and Abstracts Views on Vision4Press platform.
Data correspond to usage on the plateform after 2015. The current usage metrics is available 48-96 hours after online publication and is updated daily on week days.
Initial download of the metrics may take a while.