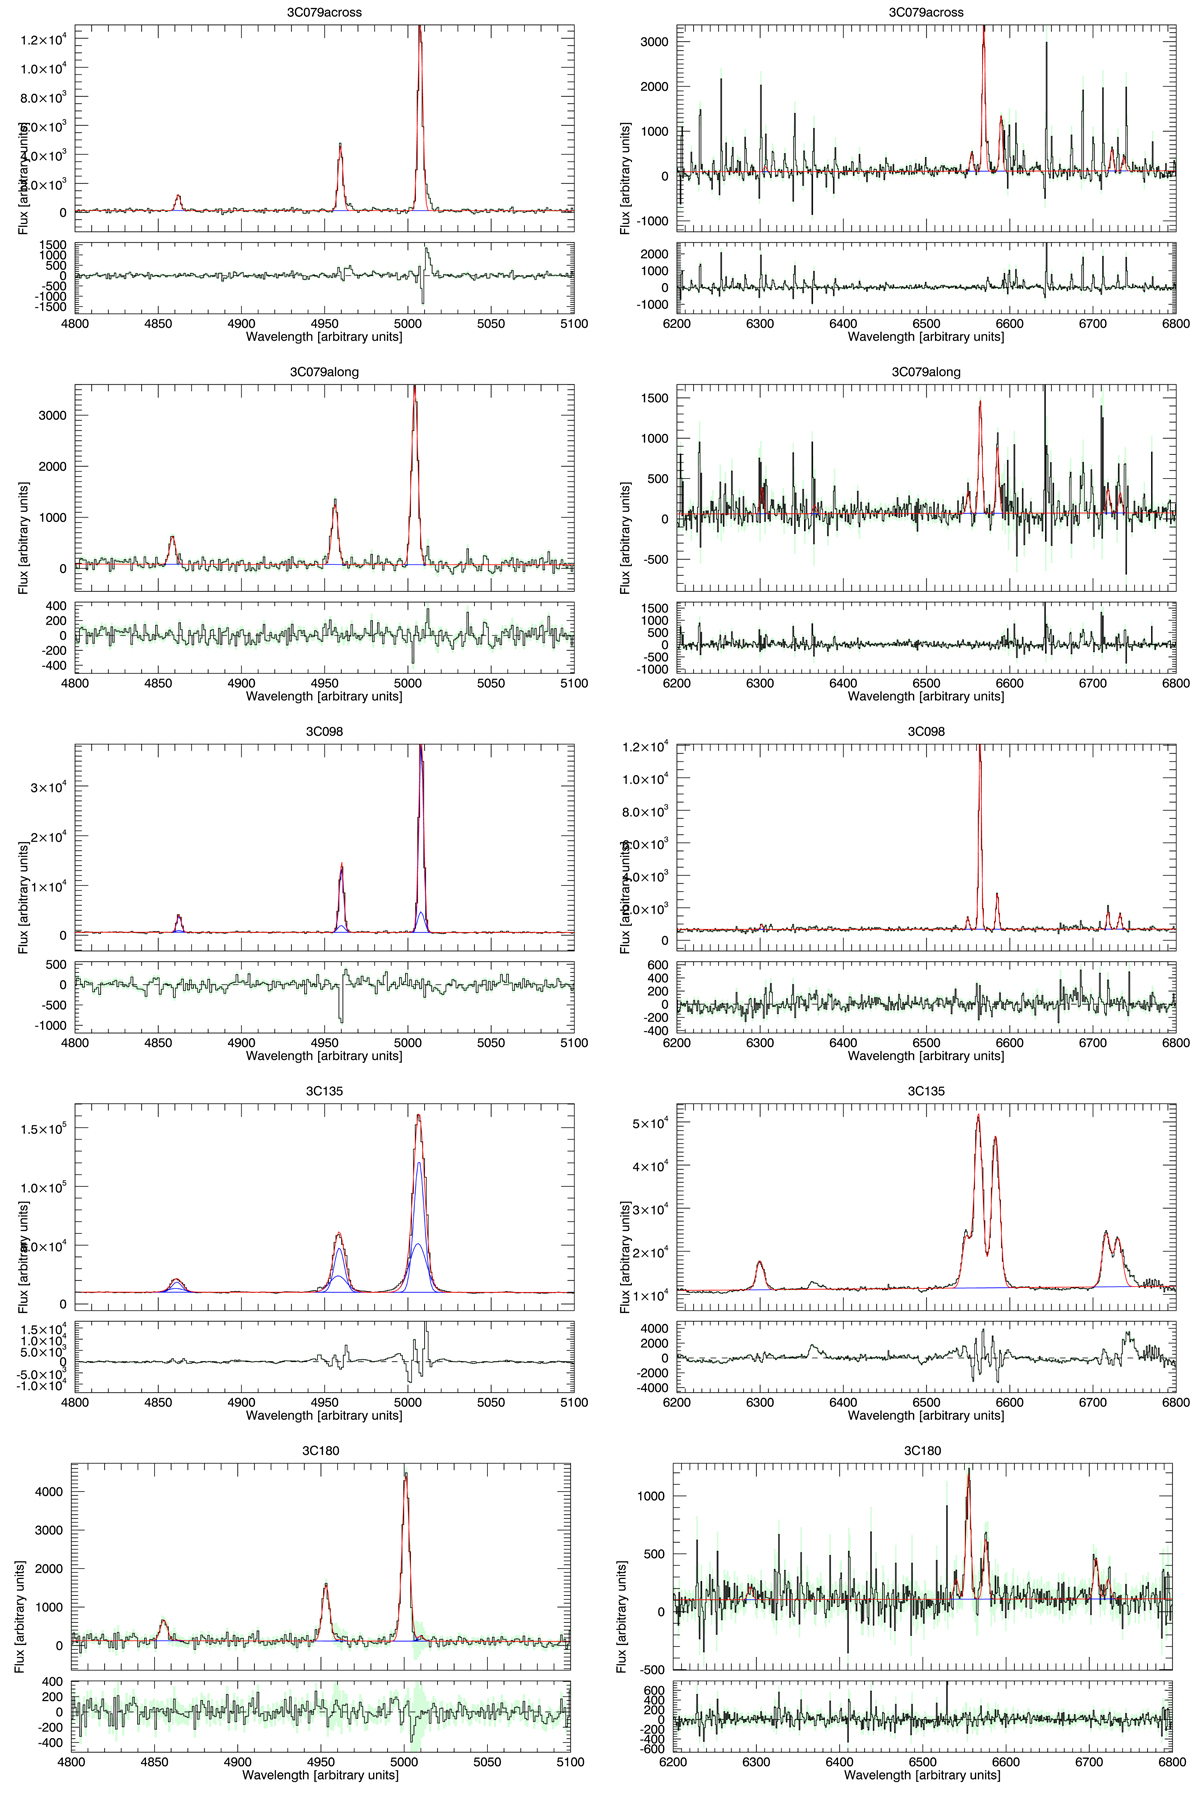
Fig. E.1.
Download original image
Off-nuclear spectra of the sources for which it was possible to obtain this information. The blue portion of the spectra are on the left side, and the red portion of spectra are on the right side. The spectra are in black, and the emission line fit is in red (when two components are required, they are shown separately in blue). The gray areas represent the errors in the spectra. The bottom panels show the residuals.
Current usage metrics show cumulative count of Article Views (full-text article views including HTML views, PDF and ePub downloads, according to the available data) and Abstracts Views on Vision4Press platform.
Data correspond to usage on the plateform after 2015. The current usage metrics is available 48-96 hours after online publication and is updated daily on week days.
Initial download of the metrics may take a while.