Free Access
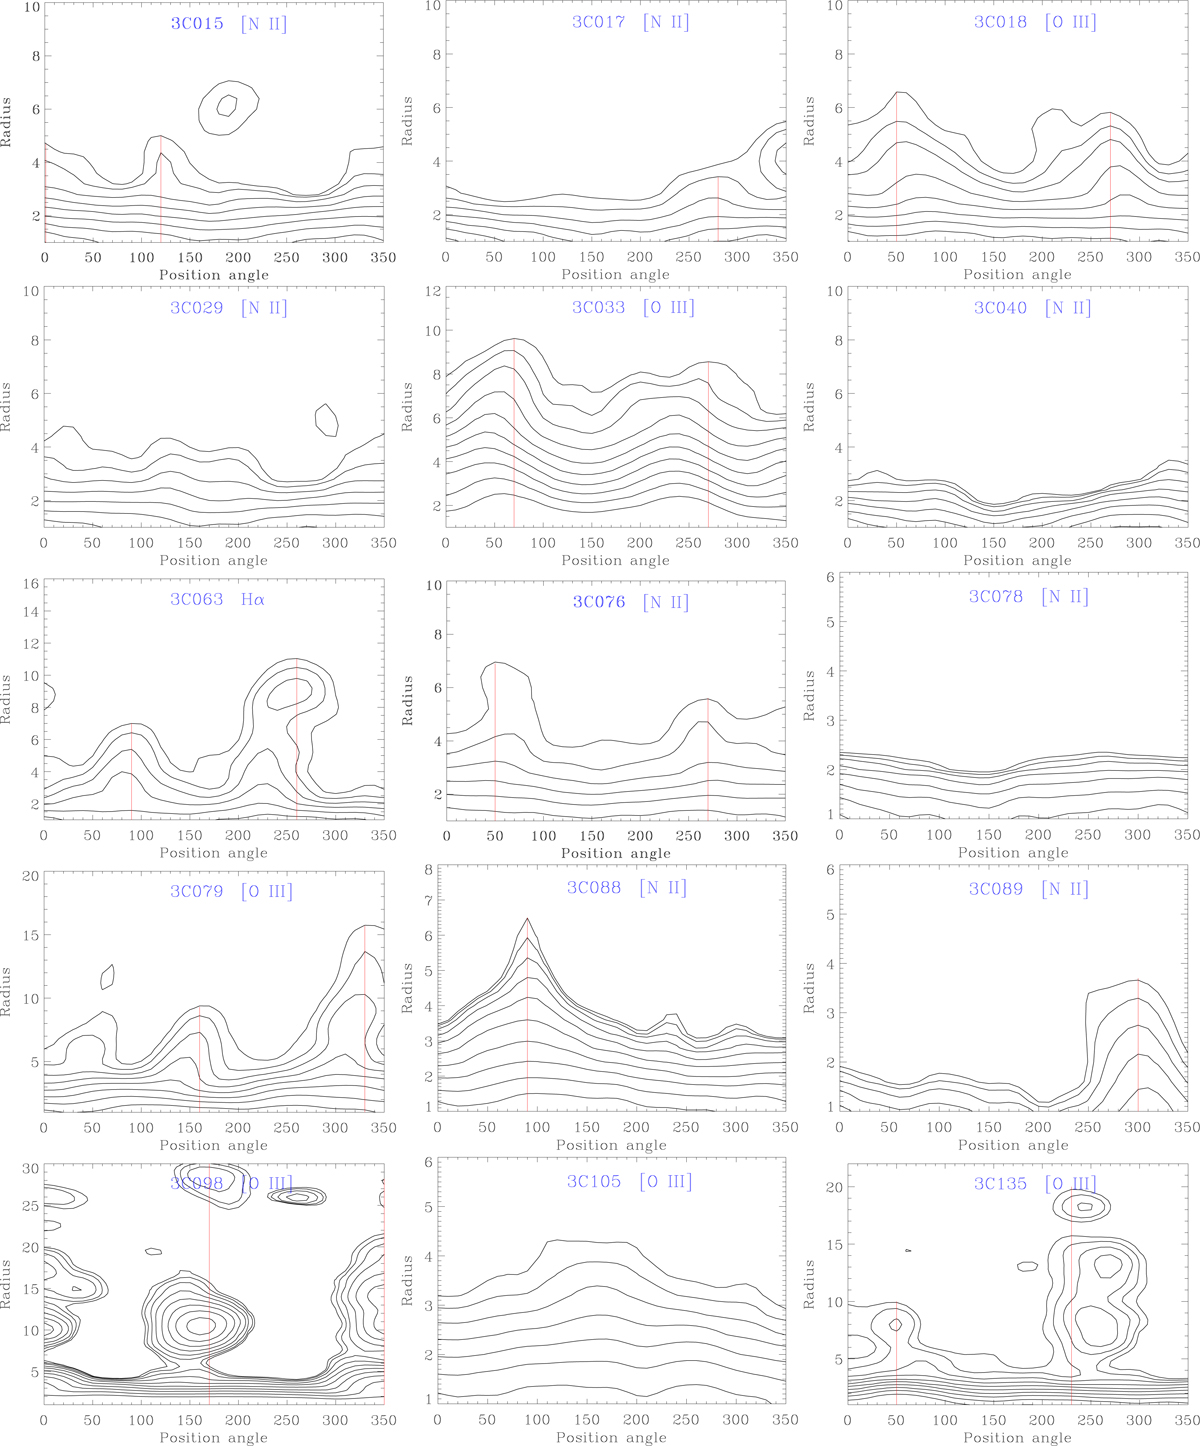
Fig. B.1.
Download original image
Polar diagrams of the emission lines reported in Tab. 1 for all the 3C radio galaxies. The solid red lines mark the ionized gas position angle on each side of the nucleus.
Current usage metrics show cumulative count of Article Views (full-text article views including HTML views, PDF and ePub downloads, according to the available data) and Abstracts Views on Vision4Press platform.
Data correspond to usage on the plateform after 2015. The current usage metrics is available 48-96 hours after online publication and is updated daily on week days.
Initial download of the metrics may take a while.