Free Access
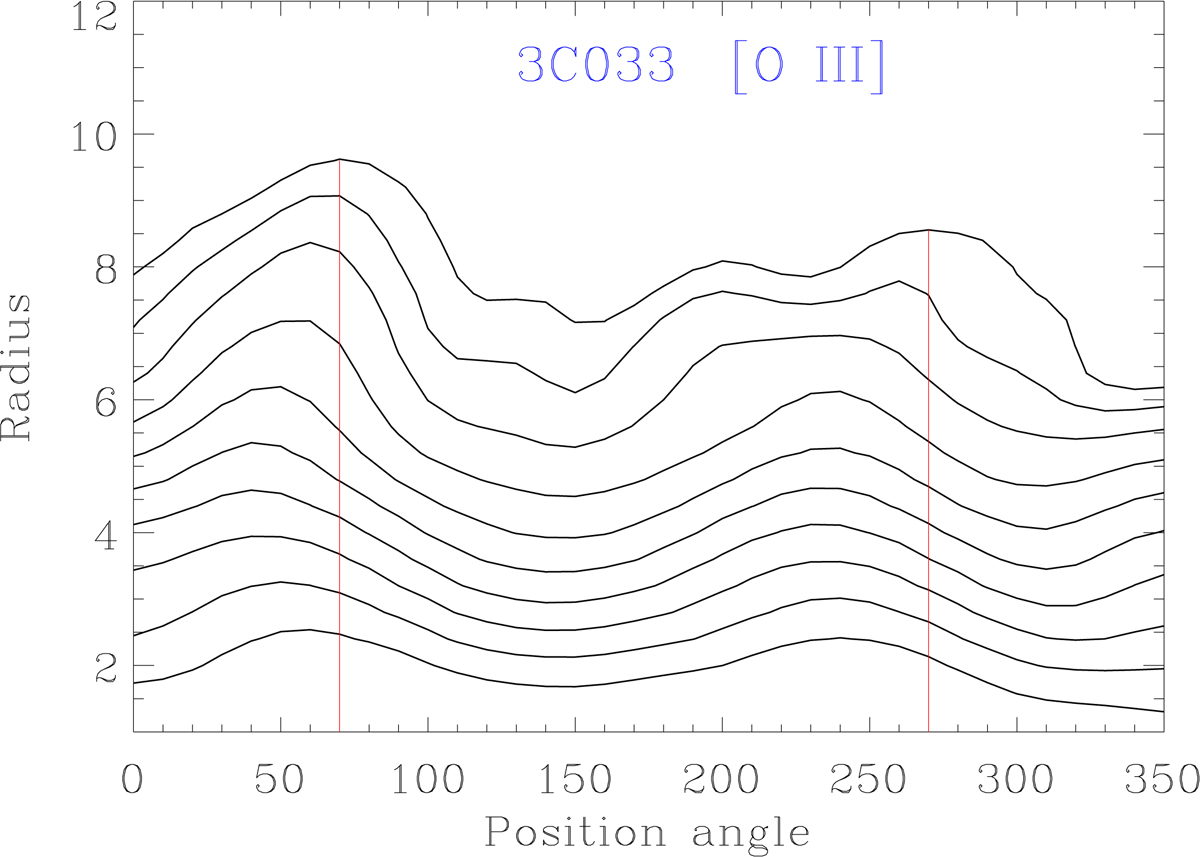
Fig. 2.
Download original image
Polar diagram of the [O III] emission line in 3C 33. Contour levels are drawn starting from three times the root mean square of the images and increase in geometric progression with a common ratio of two. The red solid lines mark the ionized gas position angle on each side of the nucleus.
Current usage metrics show cumulative count of Article Views (full-text article views including HTML views, PDF and ePub downloads, according to the available data) and Abstracts Views on Vision4Press platform.
Data correspond to usage on the plateform after 2015. The current usage metrics is available 48-96 hours after online publication and is updated daily on week days.
Initial download of the metrics may take a while.