Fig. 1.
Download original image
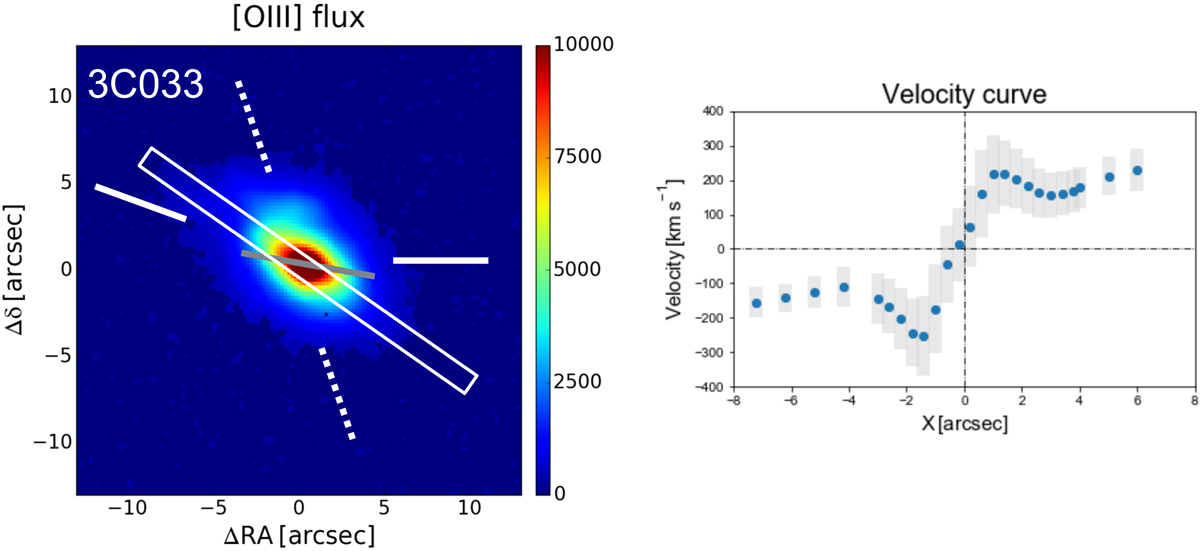
Example of the emission line properties. Left: [O III] emission line image of 3C 33. The white dotted lines mark the radio position angle, the solid white lines show the orientation of the emission line structures on both sides of the nucleus, and the gray line marks the orientation of the kinematical axis in the inner regions measured with kinemetry (see Sect. 2.2). The rectangle represents the region from which we extracted the velocity curve shown in the right panel. Data were extracted on each ![]() pixel in the innermost regions and then at distances of 1″. The length of the gray bars represents the line width at each location.
pixel in the innermost regions and then at distances of 1″. The length of the gray bars represents the line width at each location.
Current usage metrics show cumulative count of Article Views (full-text article views including HTML views, PDF and ePub downloads, according to the available data) and Abstracts Views on Vision4Press platform.
Data correspond to usage on the plateform after 2015. The current usage metrics is available 48-96 hours after online publication and is updated daily on week days.
Initial download of the metrics may take a while.