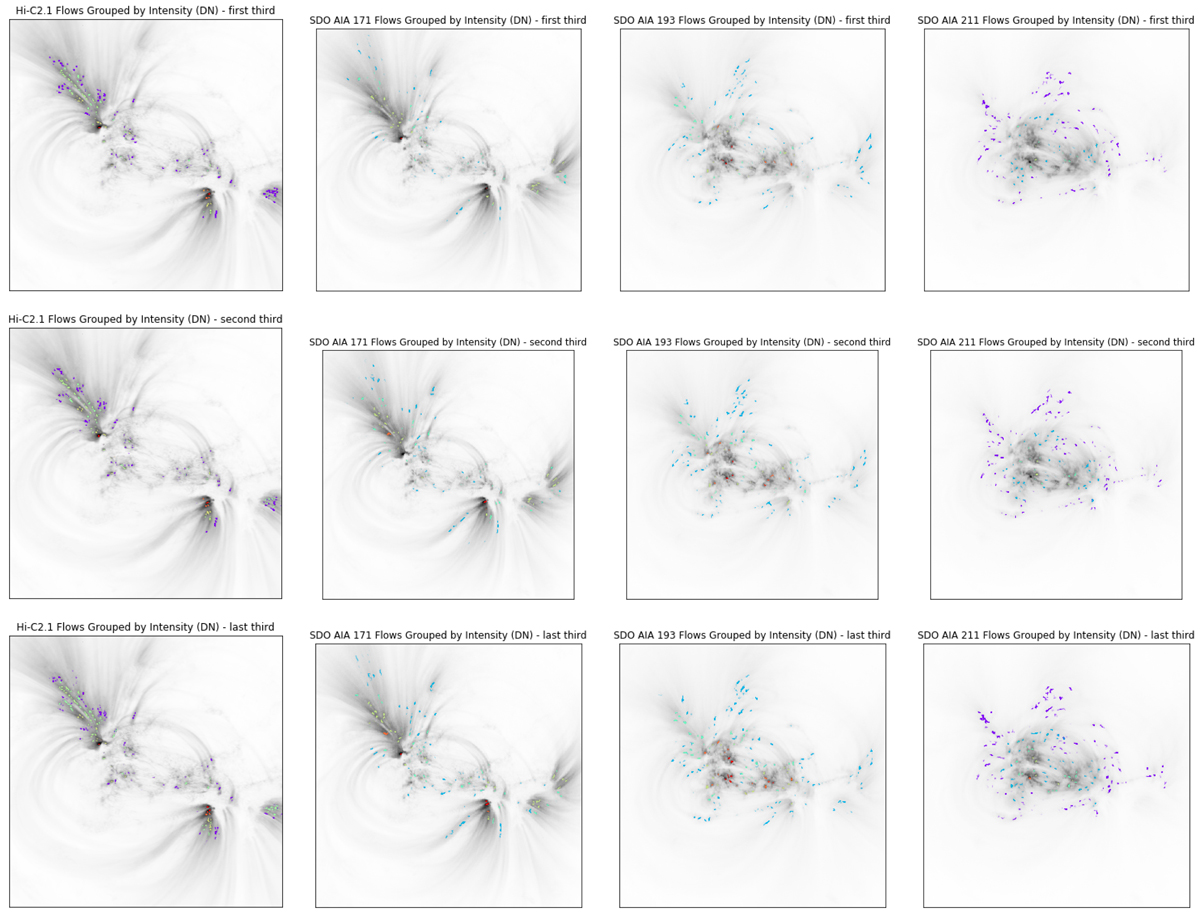
Fig. 9.
Download original image
Location of ARMCs in the active region observed during the consequent 111 s time intervals (different rows of panels), with the events’ groupings with respect to the intensity indicated. The color coding of the groups is the same as in Figs. 4 and 8. Columns from left to right represent observations with Hi-C2.1 (172 Å) and SDO/AIA 171 Å, 193 Å and 211 Å, respectively. The EUV images of the active region AR 12712 loop structure were all taken on 29 May 2018 at 18:56:21.
Current usage metrics show cumulative count of Article Views (full-text article views including HTML views, PDF and ePub downloads, according to the available data) and Abstracts Views on Vision4Press platform.
Data correspond to usage on the plateform after 2015. The current usage metrics is available 48-96 hours after online publication and is updated daily on week days.
Initial download of the metrics may take a while.