Fig. 6.
Download original image
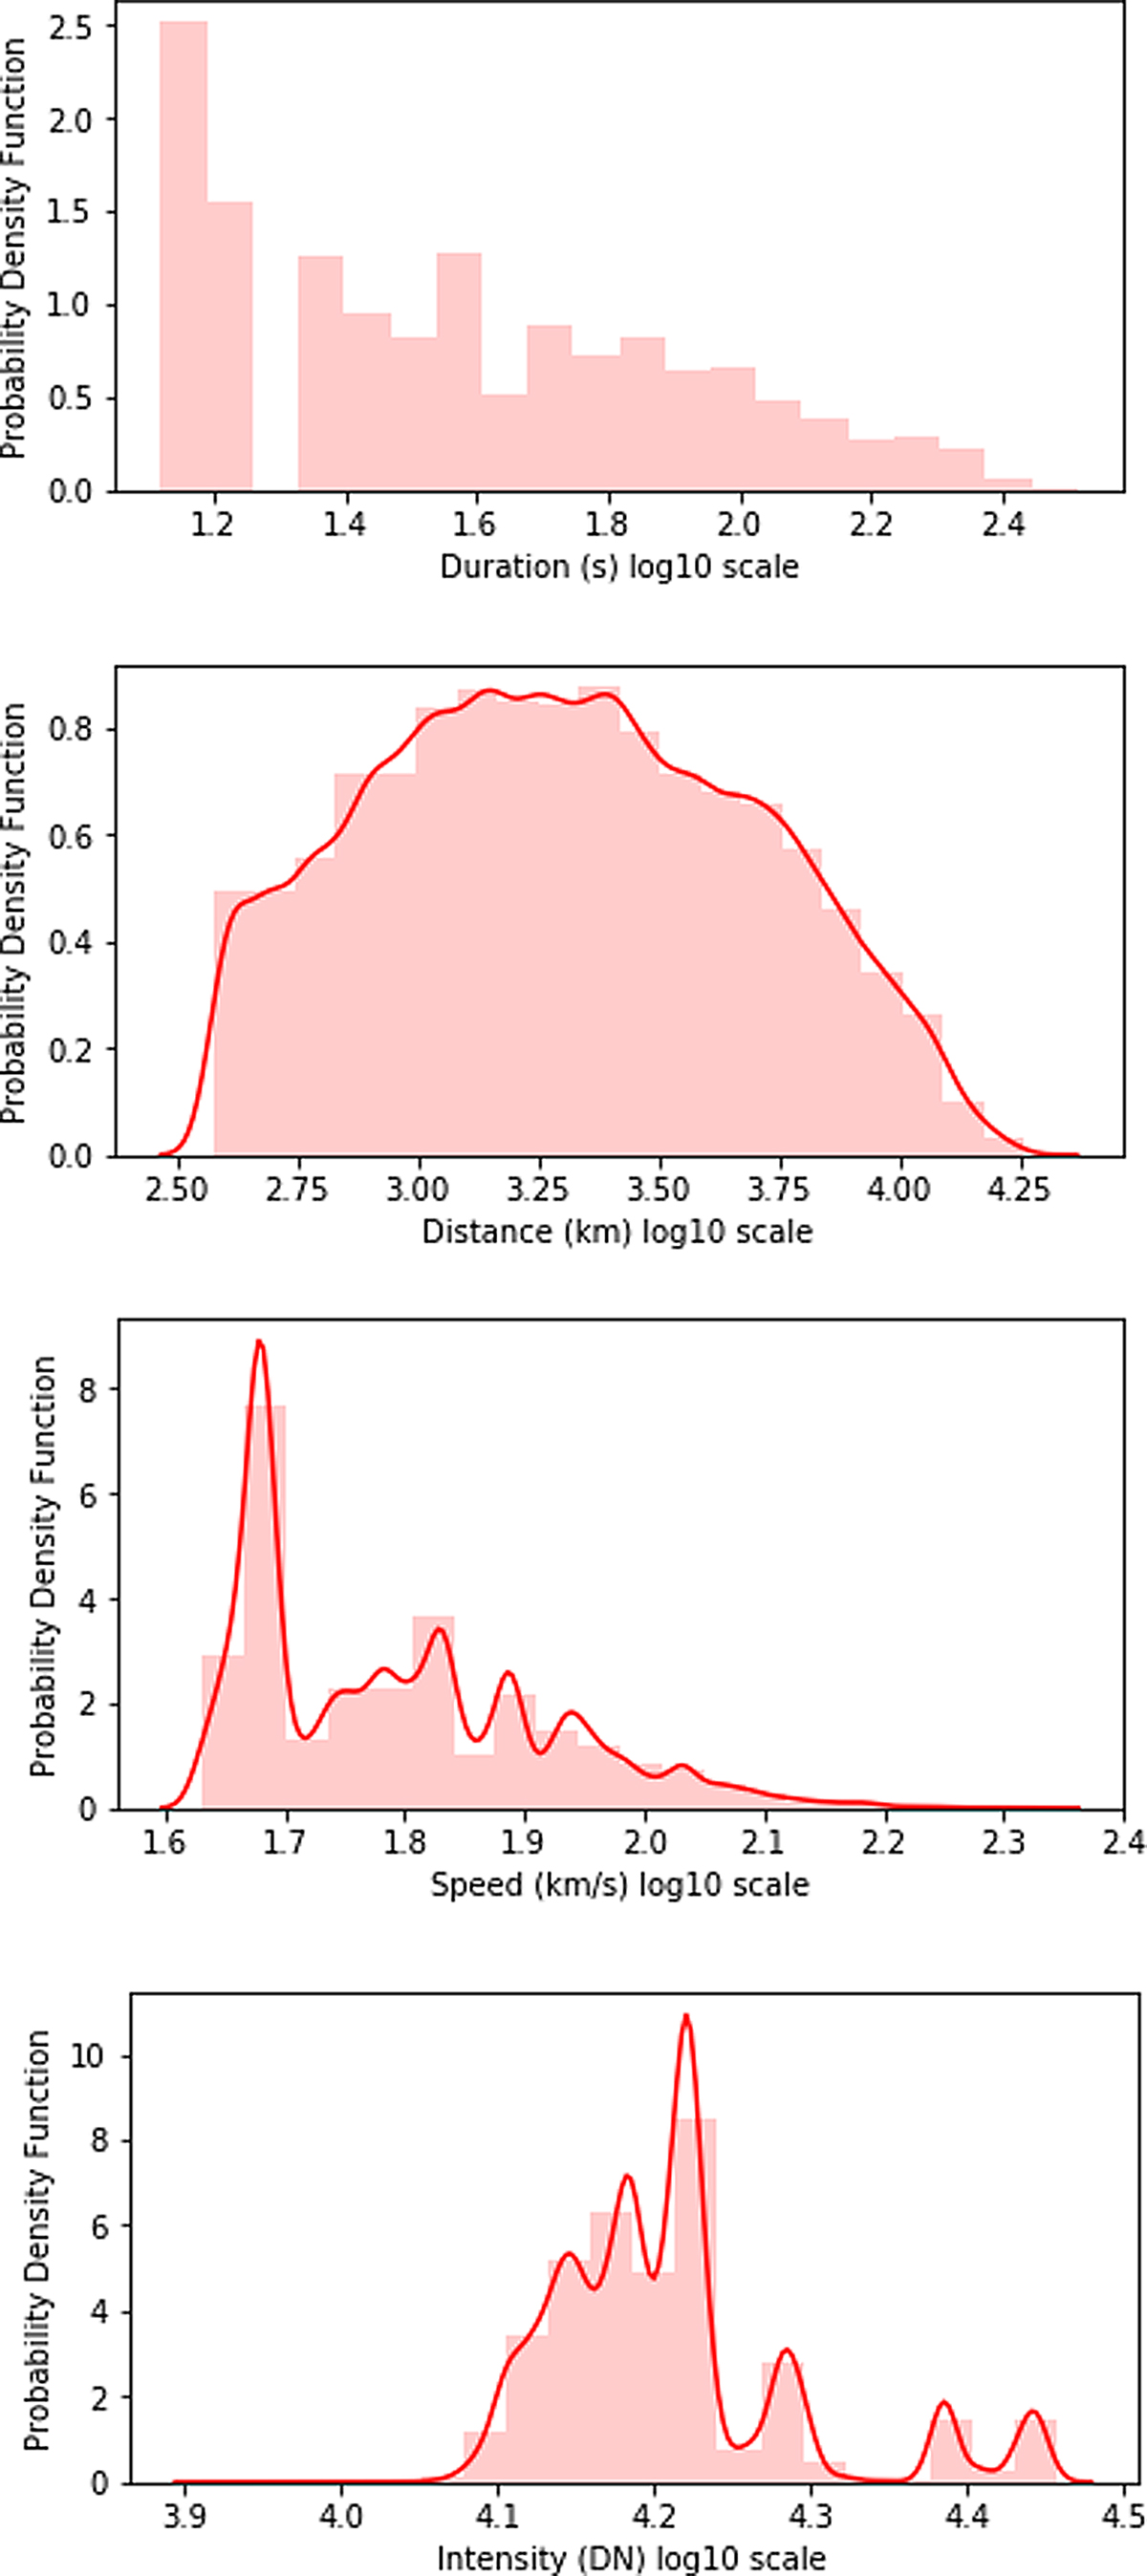
Distribution of the ARMC characteristics in histograms (shaded vertical bars) and kernel densities (solid lines), revealed from the Hi-2.1 images. From top to bottom: duration, distance, speed, and intensity. The duration and distance distributions are both unimodal, which indicates that they all belong to one group. The speed and intensity distributions are multimodal, which indicates the existence of ARMC groups.
Current usage metrics show cumulative count of Article Views (full-text article views including HTML views, PDF and ePub downloads, according to the available data) and Abstracts Views on Vision4Press platform.
Data correspond to usage on the plateform after 2015. The current usage metrics is available 48-96 hours after online publication and is updated daily on week days.
Initial download of the metrics may take a while.