Free Access
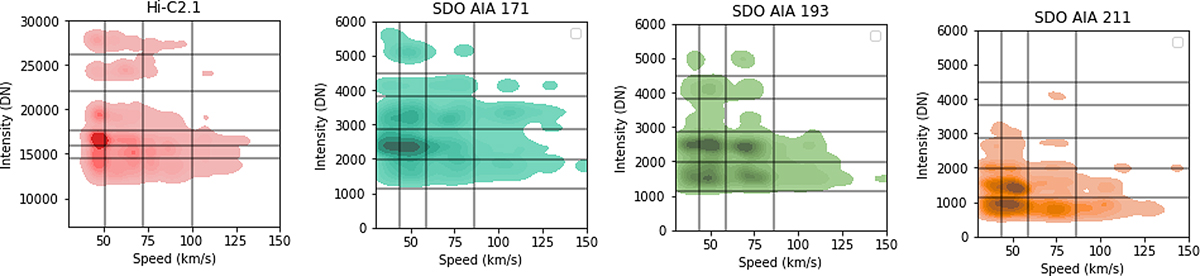
Fig. 5.
Download original image
ARMC grouping in the intensity-speed maps revealed from Hi-C2.1 172 Å data (left panel) and the SDO/AIA 171 Å, 193 Å and 211 Å data (in the second from left to the fourth panel, respectively). The color density reflects the number of the detected ARMC events.
Current usage metrics show cumulative count of Article Views (full-text article views including HTML views, PDF and ePub downloads, according to the available data) and Abstracts Views on Vision4Press platform.
Data correspond to usage on the plateform after 2015. The current usage metrics is available 48-96 hours after online publication and is updated daily on week days.
Initial download of the metrics may take a while.