Free Access
Fig. 4.
Download original image
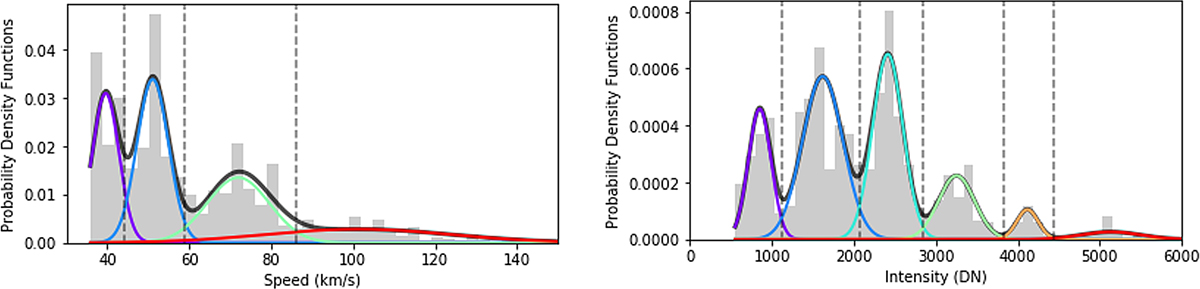
GMM fit to the combined 171 Å, 193 Å and 211 Å wavelength flow speed (top) and intensity (bottom). The vertical lines represent the points where one Gaussian density crosses another, which indicates a separation of the ARMC groups.
Current usage metrics show cumulative count of Article Views (full-text article views including HTML views, PDF and ePub downloads, according to the available data) and Abstracts Views on Vision4Press platform.
Data correspond to usage on the plateform after 2015. The current usage metrics is available 48-96 hours after online publication and is updated daily on week days.
Initial download of the metrics may take a while.