Fig. 3
Download original image
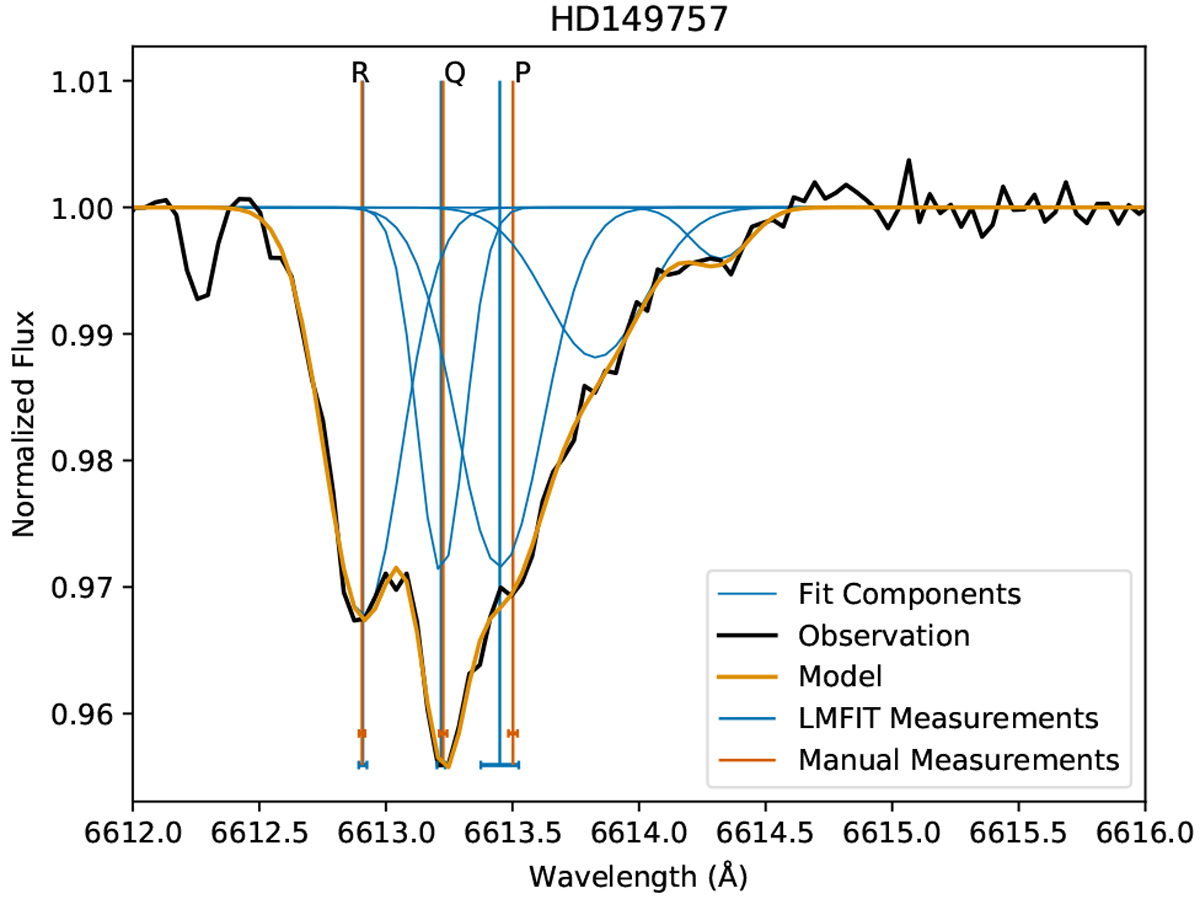
Observed λ6614 DIB profile toward HD 149757 (black) and the best fitting model profile (orange) composed of five individual Voigt profiles (blue). The blue vertical lines indicate the central wavelengths of the three main components from the model fit. Dark orange vertical lines indicate the peak positions determined with the alternative manual measurement process. Especially for the third peak, both positions differ from each other, and the peak position from the model fit does not correspond to the peak absorption. Uncertainties on these measurements are indicated by the error bars at the bottom of each line. The peak positions are labelled as P, Q or R branches, consistent with our rotational contour terminology.
Current usage metrics show cumulative count of Article Views (full-text article views including HTML views, PDF and ePub downloads, according to the available data) and Abstracts Views on Vision4Press platform.
Data correspond to usage on the plateform after 2015. The current usage metrics is available 48-96 hours after online publication and is updated daily on week days.
Initial download of the metrics may take a while.