Free Access
Fig. 1
Download original image
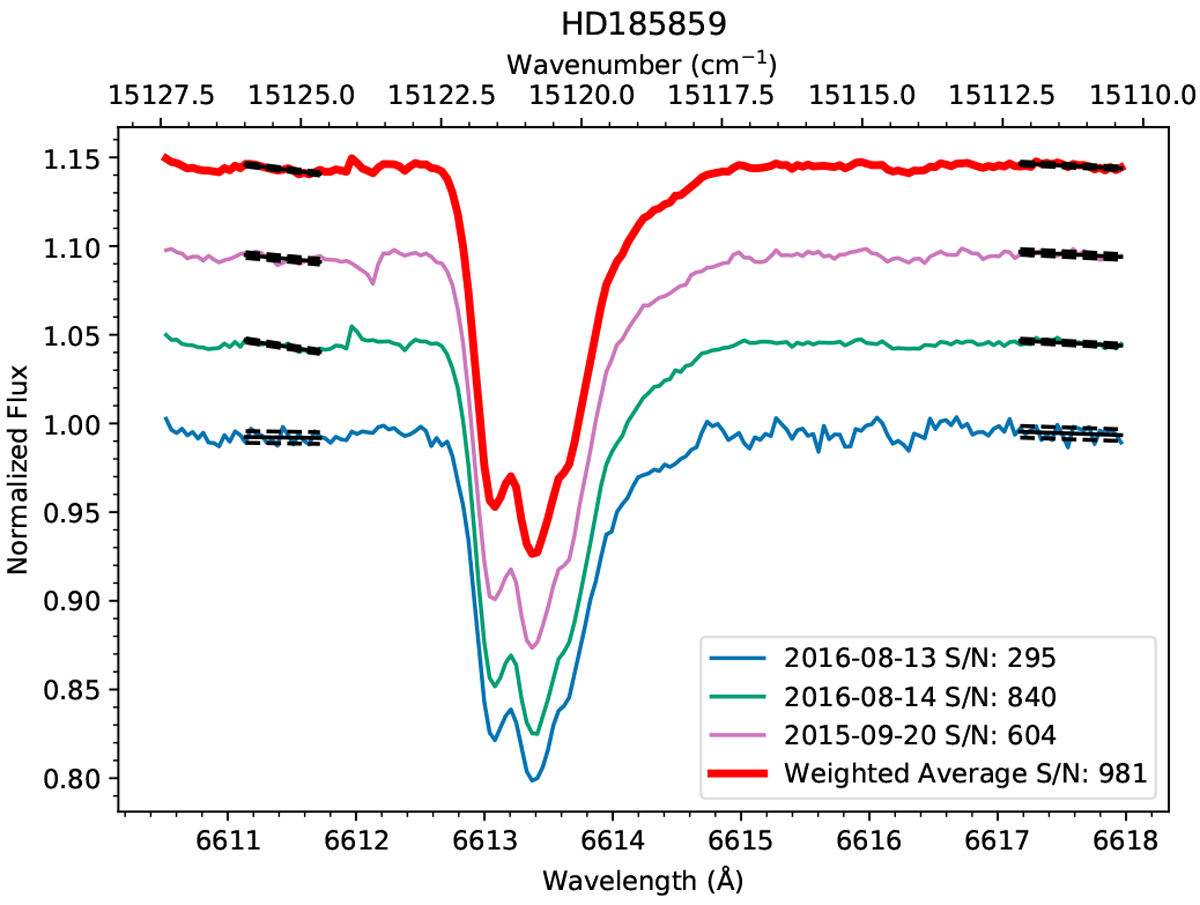
All available EDIBLES observations of the 26614 DIB toward HD 185859 (thin lines), and our weighted average spectrum (thick red line). Observation dates and S/N are indicated in the legend. The S/N was estimated from the standard deviations in the regions marked in black. A vertical offset is added for clarity.
Current usage metrics show cumulative count of Article Views (full-text article views including HTML views, PDF and ePub downloads, according to the available data) and Abstracts Views on Vision4Press platform.
Data correspond to usage on the plateform after 2015. The current usage metrics is available 48-96 hours after online publication and is updated daily on week days.
Initial download of the metrics may take a while.